
RSI explained: what the number means and how to use it in crypto
What the RSI indicator measures, how it is calculated, why 70 and 30 work in ranges but fail in trends, and how to combine RSI with support and resistance.
The relative strength index, RSI, is probably the first indicator every crypto trader adds to a chart. It’s also one of the most misread. “RSI is over 70, so it must fall” is a sentence that has cost a lot of people a lot of money, usually during the strongest rallies of the year.
This lesson takes the mystery out of RSI. You’ll see what the number measures, work through the calculation once with small numbers, and learn when the classic 70 and 30 levels help and when they mislead. It also explains why our RSI signals only run in calm, range-bound markets. You should know support and resistance before starting.
What RSI measures
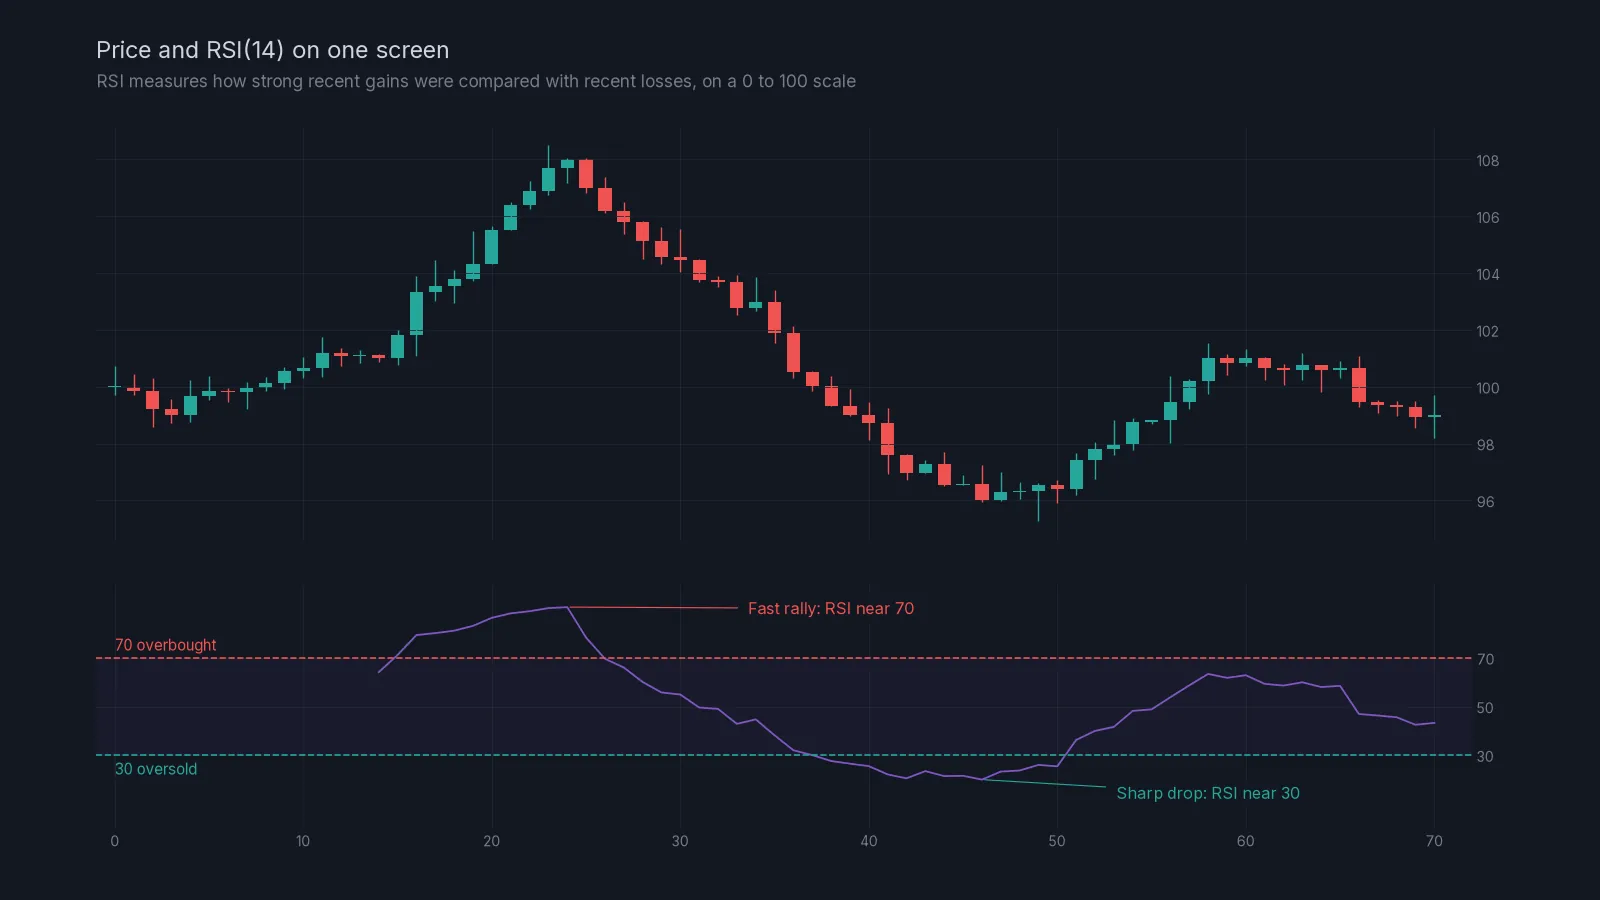
RSI looks at the last 14 candles by default and asks a simple question: of all the movement in that period, how much was up and how much was down?
If every candle went up, RSI is 100. If every candle went down, it’s 0. If the ups and downs were about the same size, it’s around 50. So RSI is a measure of momentum: how one-sided recent price action has been.
The calculation, once, with small numbers
You’ll never need to calculate RSI by hand, but doing it once makes the indicator much less mysterious. To keep it short, we’ll use 5 candles instead of 14.
Closing prices: 100, 102, 101, 104, 103, 106.
| Candle | Close | Change | Gain | Loss |
|---|---|---|---|---|
| 1 | 102 | +2 | 2 | 0 |
| 2 | 101 | -1 | 0 | 1 |
| 3 | 104 | +3 | 3 | 0 |
| 4 | 103 | -1 | 0 | 1 |
| 5 | 106 | +3 | 3 | 0 |
- Average gain: (2 + 0 + 3 + 0 + 3) ÷ 5 = 1.6
- Average loss: (0 + 1 + 0 + 1 + 0) ÷ 5 = 0.4
- Relative strength (RS): 1.6 ÷ 0.4 = 4
- RSI: 100 − 100 ÷ (1 + 4) = 100 − 20 = 80
Gains were four times bigger than losses, so RSI is high. Notice what RSI did not look at: whether 106 is a sensible price, whether there’s resistance above, or what’s happening on the higher timeframe. It only measured the balance of recent moves.
After the first value, the real RSI uses a smoothed average (each new average is mostly the old one plus a small share of the newest candle), which makes the line steadier. The idea is the same.
Overbought and oversold
By convention, RSI above 70 is called overbought and below 30 oversold. Those words mislead beginners. They don’t mean “too expensive” or “too cheap”. They mean recent gains (or losses) were large compared with the other side.
That’s useful information, but its meaning depends on the market’s state, which you learned to identify in lesson 03.
Ranges and trends behave differently
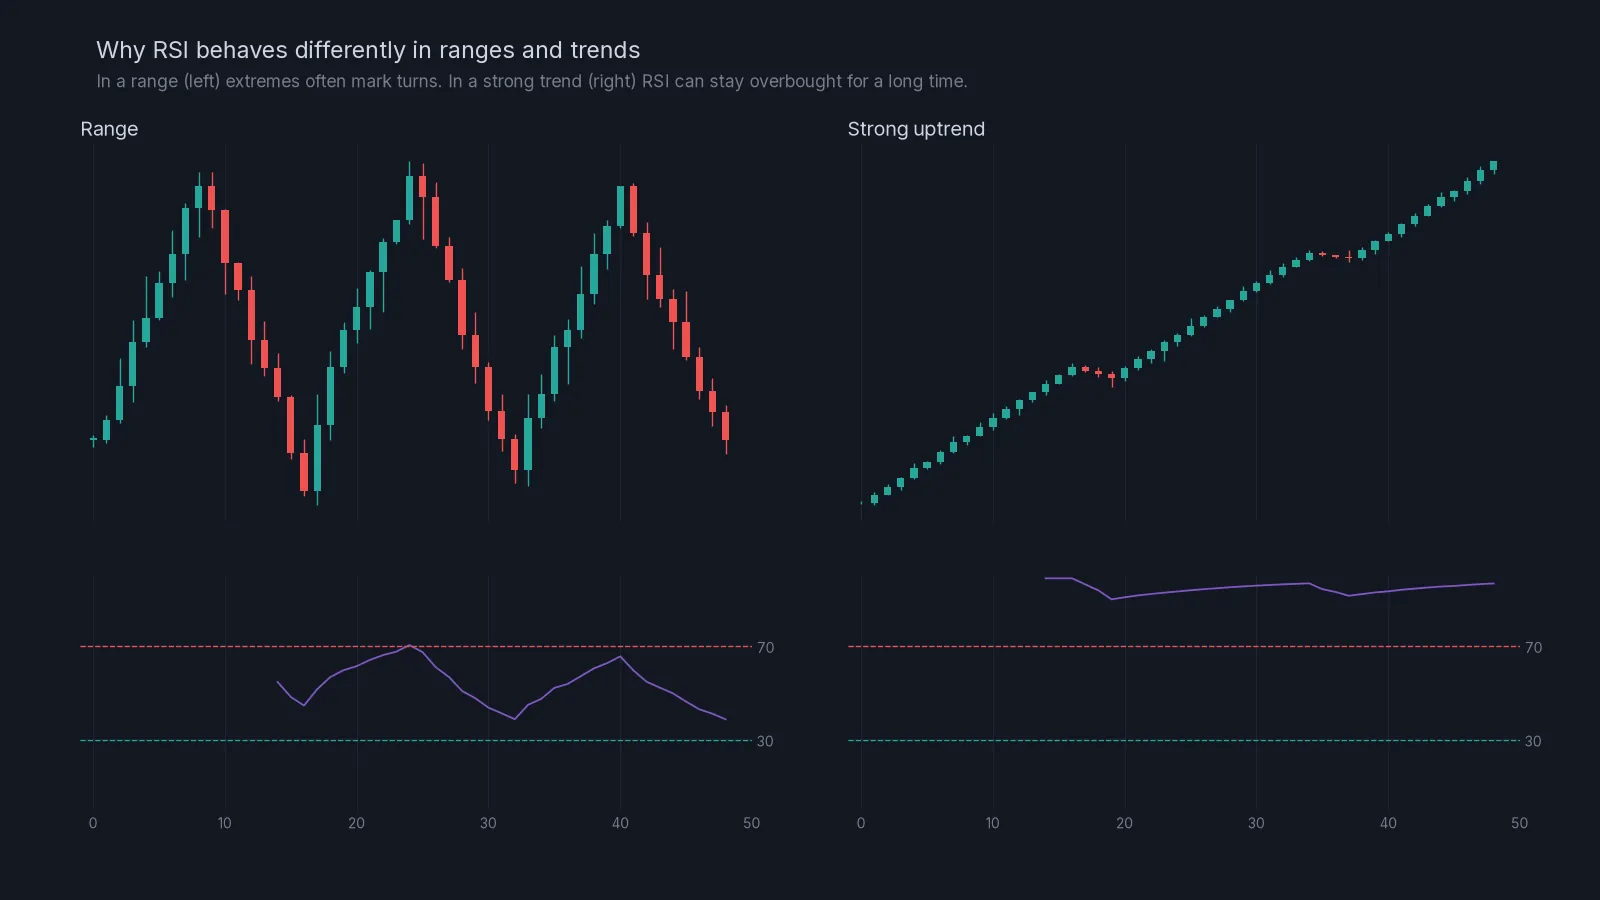
In a range, price moves between support and resistance. Each push to the top is a burst of buying that runs out, so RSI rises towards 70 near the top and falls towards 30 near the bottom. Here the classic reading works reasonably well: RSI high at resistance supports a short idea, RSI low at support supports a long one.
In a strong trend, buying keeps coming. Each candle is mostly up, so RSI stays above 70, sometimes for days. Selling every time RSI crosses 70 in that market means shorting a train. In a strong downtrend, the same happens below 30.
That single difference is why our RSI long and short signals are only sent when conditions are stable and range-like, and are switched off in strong trends. The indicator hasn’t changed; the market has.
How to tell which one you’re in
- Check market structure on the 4-hour chart: a clear series of higher highs or lower lows means trend.
- Look at where RSI spends its time. In an uptrend it tends to stay between 40 and 80 and pullbacks stop near 40 to 50. In a range it swings across the full 30 to 70 band.
- If RSI has been above 70 for many candles in a row, assume trend until shown otherwise.
Using RSI with levels
The most reliable way to use RSI is as confirmation at a level you marked before price got there.
A worked example: SOL has been ranging between 170 and 185 on the 4-hour chart for two weeks. You’ve marked resistance at 184 to 186. Price climbs into the zone, and the 1-hour RSI reads 74. A pin bar forms with its wick at 186.2 and closes at 183.9.
- Level: yes, marked in advance.
- State: range, so RSI extremes are meaningful.
- RSI: above 70 at resistance, supporting the idea that buying is stretched.
- Candle: a rejection wick, as covered in lesson 06.
A short plan could use a stop above the zone at 187.5, about 2% from a 183.9 entry. With a $3,000 account and 1% risk ($30), the position would be roughly $30 ÷ 0.0196, or about $1,530. The same RSI reading in the middle of the range, away from any level, would be far less interesting.
Settings
The default length of 14 is fine. Shorter settings (such as 7) make RSI jumpier and hit extremes more often; longer ones (such as 21) make it smoother and slower. Changing the settings to make past signals look better is a trap called curve fitting. Pick 14 and learn how it behaves on the coins you trade.
An RSI checklist:
- Identify the market state on the 4-hour chart: range or trend?
- If it’s a strong trend, don’t use RSI extremes as reversal signals.
- Mark the levels first, then look at RSI.
- At a level, note whether RSI is at an extreme and whether it agrees with the level’s direction.
- Look for a rejection candle as well. RSI alone is not enough.
- Place the stop beyond the level, not where RSI might turn.
- Size from the stop distance.
Common mistakes
Shorting because RSI is above 70. In trends that’s the most expensive habit in trading.
Ignoring the timeframe. RSI on the 5-minute chart hits 70 and 30 constantly. Read it on the timeframe you plan on.
Using RSI without levels. RSI tells you about speed, not location. Combine it with support and resistance.
Tweaking settings until the past looks good. Keep 14.
Treating 50 as meaningless. RSI crossing and holding above or below 50 is a simple read of which side has momentum.
What’s next
The next lesson covers RSI divergence, when price and RSI disagree, and the one after it explains when RSI signals fail. After that, move on to risk management with the position sizing lesson and practise with the position size calculator. If you’re curious how our RSI signals are delivered, see the signal types on the home page.
Check yourself
Answer in your head first, then open the answer.
Over the last 14 candles, gains were three times larger than losses. Roughly what is RSI?
Show answer
RS is 3, so RSI is 100 − 100 ÷ 4 = 75.
RSI on the 4-hour chart has been above 70 for 30 candles in a row. What does that suggest?
Show answer
A strong uptrend. Treat the high RSI as a sign of strength, not as a reason to short.
In a range, price reaches marked resistance with RSI at 73 and a rejection wick. Is this a stronger or weaker short idea than RSI 73 in the middle of the range?
Show answer
Stronger, because the RSI extreme lines up with a level marked in advance and a rejection candle.
Why don’t our RSI signals run in strong trends?
Show answer
Because in trends RSI can stay at extremes for a long time, so readings above 70 or below 30 stop marking turns.
Frequently asked questions
What is the best RSI setting for crypto?
The default of 14 works well. Shorter settings react faster but give more false extremes; longer ones are smoother but slower.
Is RSI a leading or lagging indicator?
It’s calculated from past closes, so it describes what has happened. It can show momentum fading before price turns, which is why some people call it leading, but it doesn’t predict.
What does RSI divergence mean?
Price makes a new high (or low) while RSI doesn’t, which shows momentum fading. The next lesson, RSI divergence, covers it in full, and the glossary has a short definition of divergence.
Can I trade using only RSI?
It isn’t a good idea. RSI measures speed, not location. Combine it with levels, market structure and a stop.
Crypto AI Signals sends liquidity shorts, RSI and AI plans to a private Telegram channel, each with an entry and a stop; you place and manage the trade yourself. Try it for 7 days or read the FAQ.
Risk notice. This lesson is education, not financial advice. Crypto futures are leveraged and you can lose some or all of the capital you trade with. A stop-loss limits a loss to the level you set; slippage and fast markets can make it larger. Past examples do not predict future results. Every trade you place is your own decision.