
Order blocks vs liquidity zones: what’s the difference?
Order blocks and liquidity zones are often mixed up. Learn what each one is, how to mark them, when they line up and why liquidity comes first in our plans.
Spend a week in crypto trading videos and you’ll hear “order block” and “liquidity” used in the same breath, sometimes as if they were the same thing. They aren’t. They describe different parts of the chart, for different reasons, and they answer different questions. Confusing them leads to stops in the wrong place and entries on the wrong side of a move.
This lesson explains both ideas plainly, shows where each one sits on the chart and how to combine them. It assumes you have read lesson 07 on sweeps and lesson 08 on liquidity zones.
What an order block is
An order block is usually defined as the last opposite candle before a strong move that breaks structure. For a bullish order block, that’s the last red candle before a sharp rally that closes above a previous swing high. For a bearish order block, it’s the last green candle before a sharp drop that breaks a swing low.
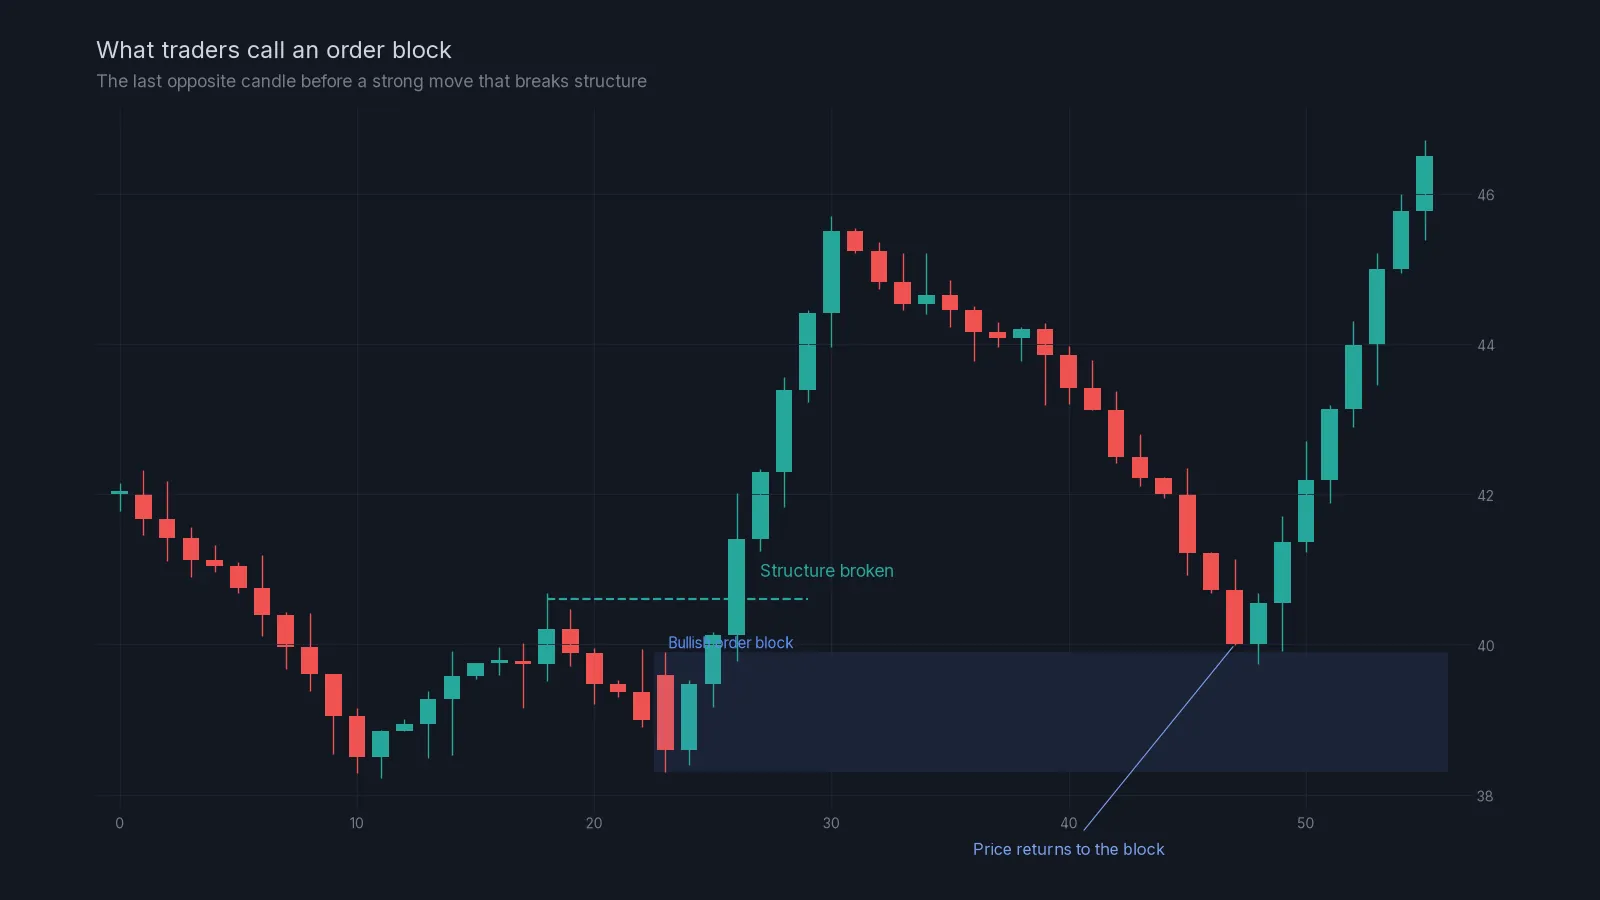
The idea behind it: a large buyer accumulated during that red candle and then pushed price up hard. Some of their orders may not have filled. When price comes back to that area, the remaining interest may show up again and cause a reaction.
How to mark one:
- Find a strong move that broke structure, ideally with large candles and high volume.
- Find the last candle in the opposite direction just before the move started.
- Mark a zone from its high to its low (some traders use the body only).
- Extend it to the right and wait for price to return.
What a liquidity zone is
A liquidity zone, as covered in lesson 08, is an area where resting orders are likely: just above equal highs, above clean swing highs, below equal lows and below clean swing lows. It’s not about where a move started; it’s about where stops and pending orders are waiting.
Side by side
| Order block | Liquidity zone | |
|---|---|---|
| What it marks | Where a strong move started | Where resting orders are likely |
| How it forms | One candle before a structure break | Repeated highs or lows |
| Question it answers | Where might price react on a return? | Where is price likely to travel? |
| Typical use | Entry area on a pullback | Target for price, or entry for a sweep fade |
| Main risk | Many blocks never react | Sweeps can turn into breakouts |
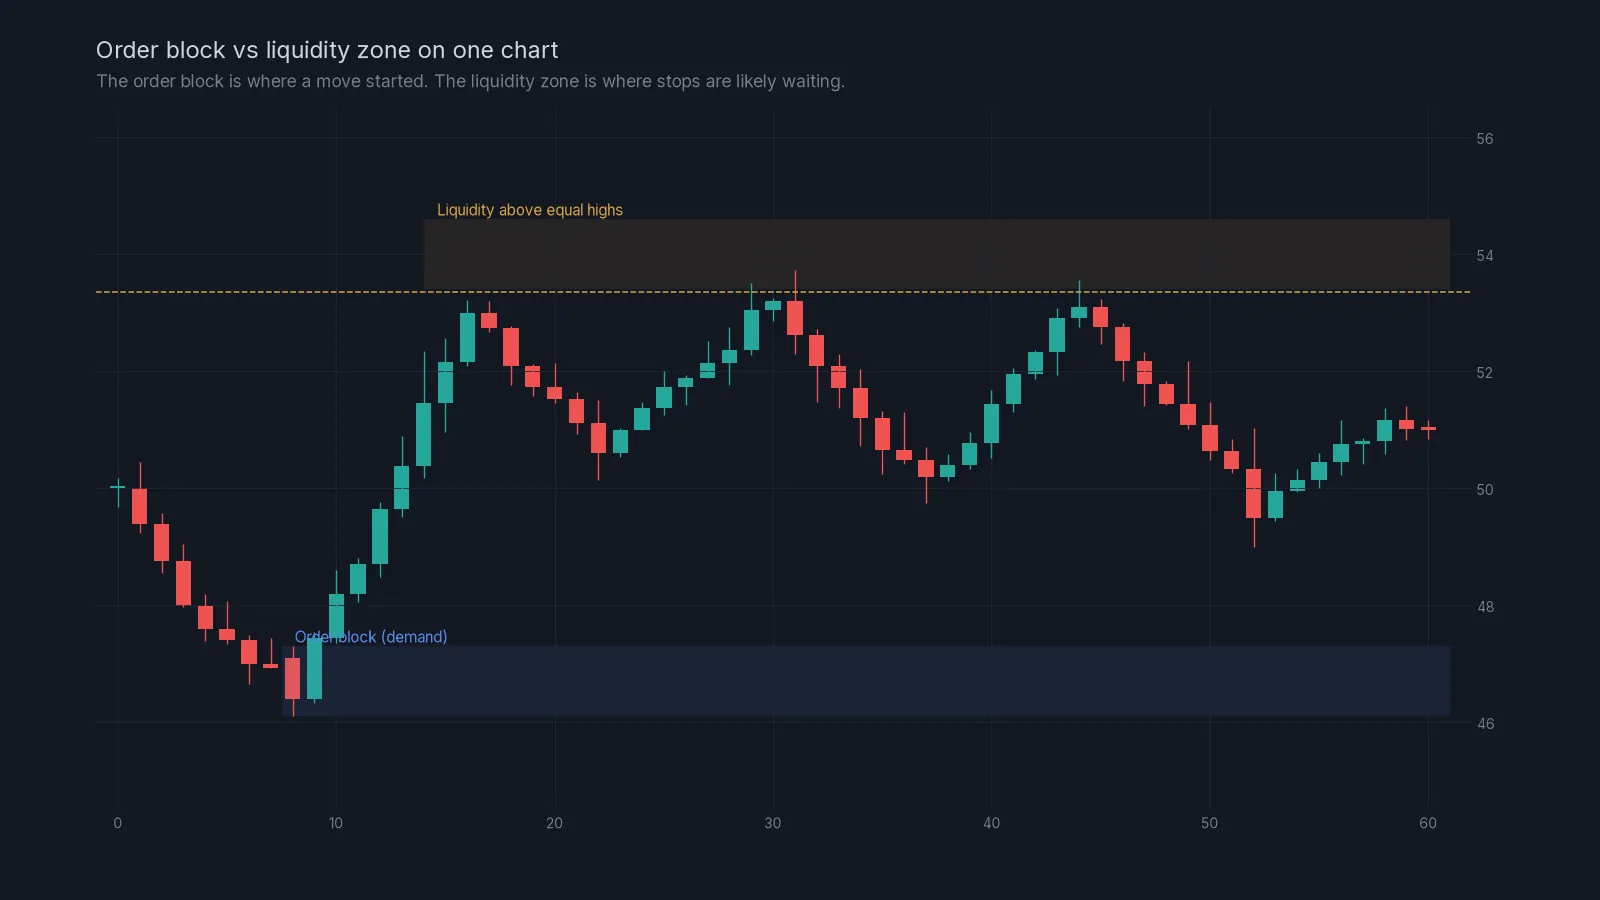
The two often work in sequence. A common pattern on crypto charts: price rallies from a bullish order block, runs up into equal highs, sweeps the liquidity above them and turns. The sweep is the liquidity part; the start of the rally was the order block part. Reading both lets you understand the whole move instead of one piece of it.
When they line up
The strongest areas are where several ideas agree. Examples:
- A bearish order block sitting just above equal highs. A sweep of the highs runs straight into the block, where sellers who started the last drop may defend again. That’s a cleaner short area than either idea on its own.
- A bullish order block just below a clear swing low. A sweep of the low dips into the block before reversing.
- Either one lining up with a higher-timeframe support or resistance zone or a round number.
When they don’t line up, rank them. In our liquidity plans, the liquidity level comes first, because it’s the reason price is expected to travel to the area at all. An order block nearby can add confidence; it doesn’t replace the level.
A worked example
On the 1-hour ETH chart, price dropped sharply from 3,520 to 3,380 two days ago, breaking a swing low. The last green candle before that drop ran from 3,495 to 3,520: a bearish order block. Since then, price has bounced and formed two highs at 3,478 and 3,482, just below the block.
So the chart shows liquidity above 3,482 and an order block from 3,495 to 3,520 right above it. A plan could put zone 1 at the equal highs (level 3,482, entry 3,489, stop 3,559) and treat the order block as a reason to think a sweep may fail there. If price slices through the block and closes above 3,520 on the 1-hour, both ideas have failed and the stop is where the plan admits it.
Grading order blocks honestly
Most order blocks never cause a reaction. Online, you’ll see the ones that worked. To avoid fooling yourself:
- Only mark blocks before strong moves that actually broke structure. A small drift doesn’t count.
- Prefer the first return to a block. Each later visit is weaker.
- Ignore blocks deep inside a range; they rarely matter.
- Track your marked blocks in a journal and count how many reacted. Your own numbers beat anyone’s claims.
Using both ideas on one chart:
- Read structure on the 4-hour and 1-hour charts.
- Mark liquidity: equal highs, equal lows, clean swing points.
- Mark order blocks only where a strong move broke structure.
- Look for overlaps between the two, and with higher-timeframe levels.
- Build the plan around liquidity, using order blocks as supporting evidence.
- Place the stop beyond both areas where they overlap.
- Size from the stop and write down what would invalidate the idea.
Common mistakes
Calling every candle an order block. If every pullback starts at an “order block”, the term has lost its meaning.
Using order blocks against the trend. A bullish block in a strong downtrend is more likely to break.
Stops inside the block. If the block is the reason for the trade, the stop goes beyond it.
Confusing the two directions. Liquidity above highs consists of buy orders. A sweep there can fuel a short if it fails, but it can also fuel a breakout. The order block nearby helps decide which.
Next module
You’ve finished the liquidity module. Next is RSI: lesson 10, RSI explained. If you’d like to see a liquidity plan as we send it, the home page shows an annotated example chart, and the glossary has short definitions of every term in this lesson.
Check yourself
Answer in your head first, then open the answer.
What is a bearish order block?
Show answer
The last green candle before a strong drop that broke a swing low.
Which concept tells you where price is likely to travel: order block or liquidity zone?
Show answer
The liquidity zone, because resting orders attract price.
An order block sits right above equal highs. Why is that interesting for a short?
Show answer
A sweep of the equal highs would run into the order block, where sellers may defend again, so two ideas support a failure there.
Price returns to an order block for the fourth time. Is it stronger or weaker than on the first return?
Show answer
Weaker. Each visit uses up more of the interest that was left there.
Frequently asked questions
Are order blocks the same as supply and demand zones?
They’re closely related. Supply and demand zones usually cover the whole base a move started from; an order block is a narrower version focused on the last opposite candle.
Do order blocks work in crypto?
Sometimes. They’re a model of where large traders may have left orders, not a guarantee. Grade them strictly and track how often they react on the coins you trade.
Which is more important, liquidity or order blocks?
In our plans, liquidity comes first, because it explains why price travels to an area. Order blocks add confidence when they line up with it.
Crypto AI Signals sends liquidity shorts, RSI and AI plans to a private Telegram channel, each with an entry and a stop; you place and manage the trade yourself. Try it for 7 days or read the FAQ.
Risk notice. This lesson is education, not financial advice. Crypto futures are leveraged and you can lose some or all of the capital you trade with. A stop-loss limits a loss to the level you set; slippage and fast markets can make it larger. Past examples do not predict future results. Every trade you place is your own decision.