
Liquidity zones on the 1-hour chart: how a short plan is built
How to mark liquidity zones on the 1-hour crypto chart and turn them into a short plan with two or three zones, entries 0.20% above each level and a 2% stop.
Lesson 07 explained why price runs obvious highs and why sweeps often fail. This lesson turns that idea into a concrete plan: the kind of plan our liquidity short signals are built from. You’ll learn why we use the 1-hour chart, how a zone forms, how a plan with two or three zones is laid out, and exactly how the entry and reference stop are calculated.
Nothing here is secret. The method is deliberately simple, because a plan you can redraw yourself is a plan you can judge, and a plan you can judge is one you can say no to.
Why the 1-hour chart
Every timeframe is a compromise. Lower timeframes show many levels that break constantly. Higher timeframes show strong levels that only come into play every week or two.
The 1-hour chart sits in the middle. Levels there are visible to a large share of the market, so real stop clusters gather above them, and they still form often enough to plan trades every day across many coins. They also line up well with the 4-hour chart for context and the 15-minute chart for watching the reaction.
How a zone forms
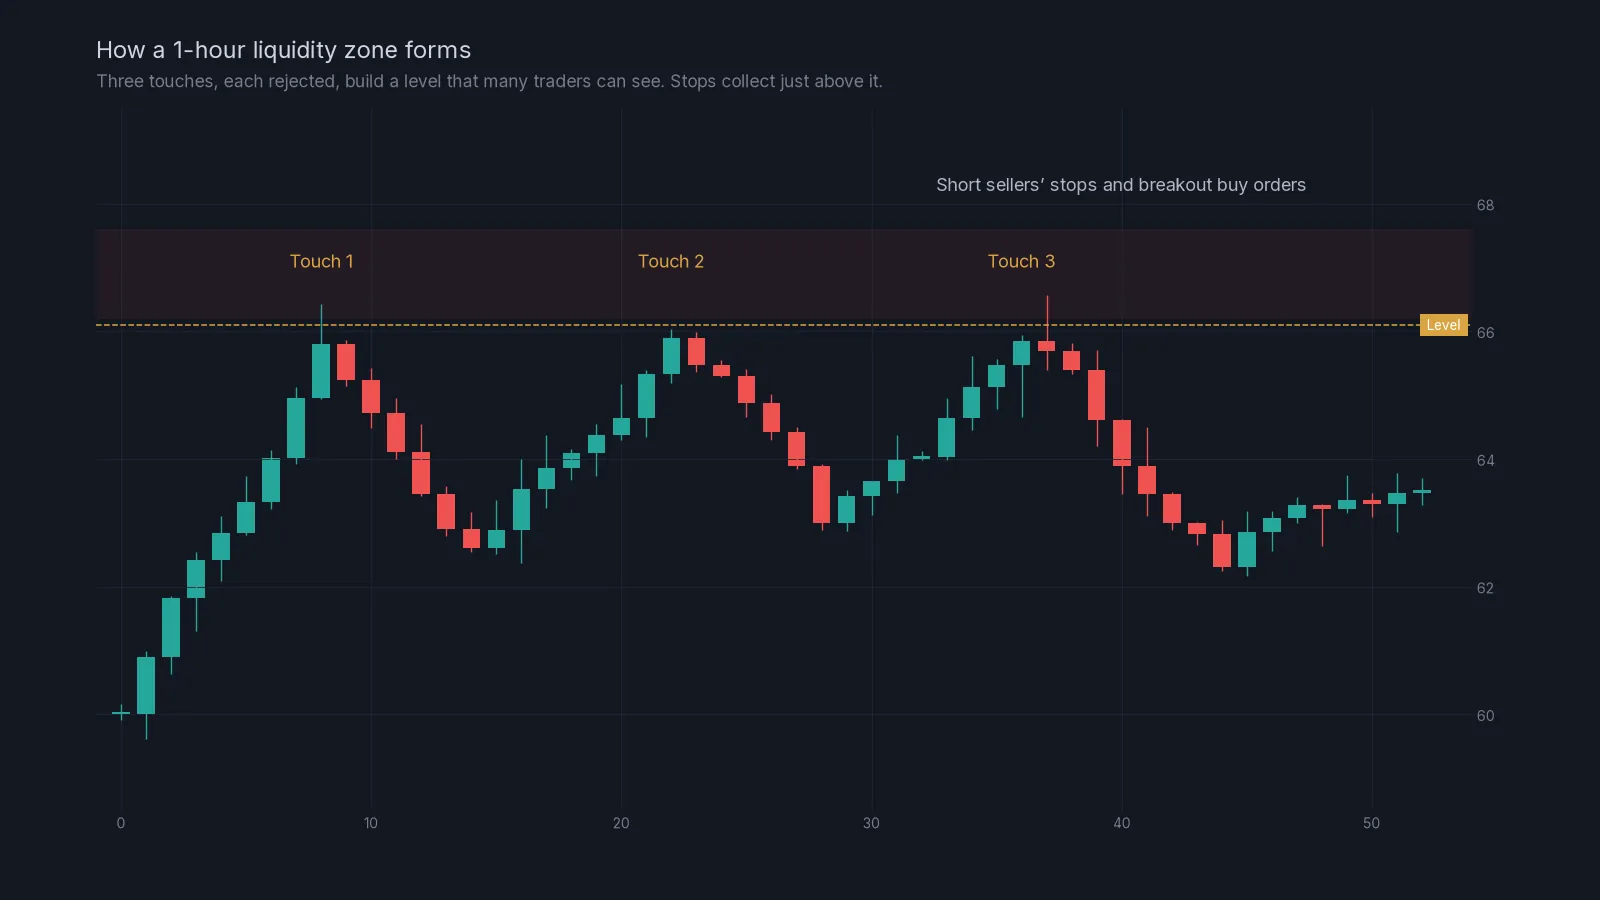
A liquidity level is a price that the market has tested and been rejected from, ideally more than once. Each touch does two things. It shows that sellers defend the price, and it makes the level more obvious to everyone, which means more short sellers put their stops just above it and more breakout traders put buy stops there.
When marking levels, look for:
- Equal or near-equal highs: two or three peaks within roughly 0.2% to 0.3% of each other.
- A clean swing high that price left sharply.
- A round number that coincides with one of the above.
Mark the level at the highs, not at the candle bodies. The stops sit above the wicks, so that’s where the liquidity is.
A plan with two or three zones
Price rarely sweeps exactly one level and turns. Sometimes it clears the nearest level and runs on to the next. A plan with several zones accounts for that.
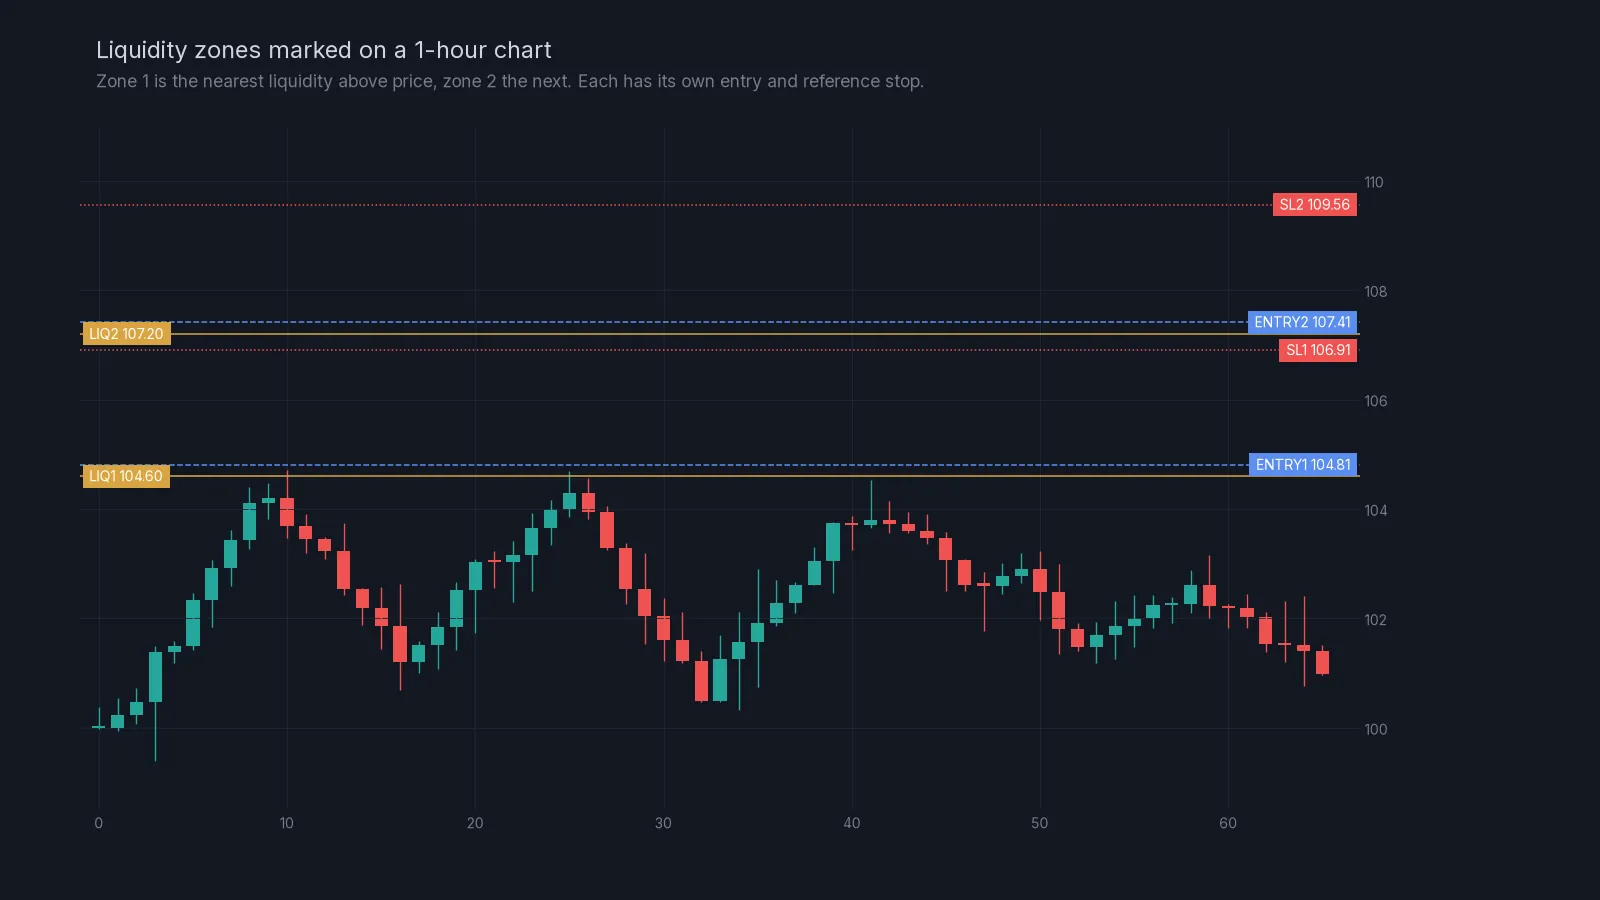
Zone 1 is the nearest meaningful liquidity above the current price. Zone 2 is the next one up, and zone 3, when there is one, sits further still. If price sweeps zone 1 and fails, zones 2 and 3 never come into play. If price runs through zone 1, its stop may be hit, and zone 2 offers a second, higher chance with its own defined risk.
The calculation, step by step
For each zone, two numbers follow directly from the level:
- Entry = level × 1.002, which is 0.20% above the level. The order sits just inside the area where stops trigger, so it fills as the sweep happens.
- Reference stop = entry × 1.02, which is 2% above the entry. That’s room for a normal sweep to overshoot without taking the stop.
Here is the plan from the chart above:
| Zone | Level | Entry (+0.20%) | Reference stop (+2%) |
|---|---|---|---|
| 1 | 104.60 | 104.81 | 106.91 |
| 2 | 107.20 | 107.41 | 109.56 |
You can check each line yourself: 104.60 × 1.002 = 104.81, and 104.81 × 1.02 = 106.91. If a level is 60,000, the entry is 60,120 and the stop is 61,322.
Why 0.20%? It’s enough to put the order inside the sweep, where the resting buy stops trigger, without being so far above the level that it only fills on the biggest runs. Why 2%? Because sweeps on majors and larger altcoins often overshoot by around a percent. A tighter stop gets taken by the very move you’re waiting for. The reasoning is covered in more depth in our article on the 2% reference stop.
Sizing across zones
The zones are not one big position split up. Treat each one as a separate trade with its own risk, and decide in advance how much total risk the plan can use.
Example: a $5,000 account, with a rule of 1% risk per plan ($50). You split it across two zones, $25 each. Each zone’s stop is 2% from its entry, so each position is $25 ÷ 0.02 = $1,250 of notional value.
- If zone 1 fills and works, zone 2 never fills.
- If zone 1 fills and its stop is hit, the loss is about $25 plus fees, and zone 2 may fill next.
- If both fill and both stops are hit, the loss is about $50 plus fees, which is the 1% you accepted at the start.
Run these numbers in the position size calculator with your own account size. Keep leverage low enough that the liquidation price is far above each stop; at 2% stops that means low single-digit leverage is plenty.
Managing the exit
Our signals don’t include a take-profit, on purpose. Where a sweep runs out of steam depends on what happens after the entry, and traders manage exits in different ways. Common approaches:
- Take part of the position off at the nearest support below, and move the stop on the rest to around the entry.
- Close when a 1-hour candle closes back above the zone’s level, because the sweep idea has weakened.
- Trail the stop above each new lower high as price falls, using what you learned in lesson 05 on market structure.
Whichever you choose, decide it before the trade and write it down.
Building a liquidity plan yourself:
- On the 4-hour chart, check the state. Ranges and downtrends suit shorts at liquidity; strong uptrends don’t.
- On the 1-hour chart, mark the nearest two or three clear levels above price: equal highs or clean swing highs.
- For each level, calculate the entry (× 1.002) and the stop (entry × 1.02).
- Decide your total risk for the plan and split it across the zones.
- Size each zone from its stop distance.
- Check leverage and liquidation for each zone.
- Place limit orders, or set alerts if you’d rather watch the reaction first.
- Write down how you’ll manage the exit.
- Cancel the plan if price leaves the area or the structure changes before the zones are reached.
Common mistakes
Treating all zones as one trade. Size each separately, or a run through both zones costs far more than you planned.
Shorting a strong uptrend. Liquidity above highs in a trending market is often the fuel for the next leg up. Check structure first.
Moving the stop after entry. The 2% stop is the point at which the sweep idea is no longer working. Moving it further turns a planned loss into an open one.
Leaving stale orders. A plan made yesterday may not fit today’s chart. Review open limit orders at least once a day.
Using high leverage. A 2% stop with 50x leverage means liquidation before the stop.
Next lesson
Order blocks are another popular idea that is often confused with liquidity. Lesson 09 explains the difference and when they line up. If you’d like to receive plans like this, drawn on annotated charts, our pricing section explains the 7-day trial. For a full worked example, read liquidity zones and short setups, and see how to read a crypto signal for the same plan turned into orders and a position size.
Check yourself
Answer in your head first, then open the answer.
A liquidity level is at 2,500. What are the entry and the reference stop?
Show answer
Entry is 2,500 × 1.002 = 2,505. The stop is 2,505 × 1.02 = 2,555.10.
Why is the entry placed above the level rather than at it?
Show answer
Because the stops rest above the level. An entry 0.20% above sits inside the sweep, where those stops trigger.
Your account is $4,000 and you accept 1% risk per plan, split over two zones with 2% stops. What is the notional size of each zone?
Show answer
Total risk is $40, so $20 per zone. $20 ÷ 0.02 = $1,000 per zone.
Why is there no take-profit in the plan?
Show answer
Because where a sweep runs out of energy depends on what happens after the entry. The plan defines where you’re wrong; you manage the exit.
Frequently asked questions
Why do your signals use the 1-hour chart?
Levels on the 1-hour chart are watched by many traders, so stops collect above them, and they form often enough to plan trades every day. The 4-hour chart gives context and the 15-minute chart shows the reaction.
Can I use a tighter stop than 2%?
You can, but sweeps often overshoot by around a percent, so tighter stops are hit more often. If you use a different stop, recalculate the position size so your risk in dollars stays the same.
Do I have to take every zone in a plan?
No. Many traders only take zone 1, or only take zone 2 when price clearly runs through zone 1. Each zone is a separate decision.
Does this work for longs?
The same logic works below obvious lows, with entries below the level and stops below the entry. Our liquidity signals focus on shorts above highs.
Crypto AI Signals sends liquidity shorts, RSI and AI plans to a private Telegram channel, each with an entry and a stop; you place and manage the trade yourself. Try it for 7 days or read the FAQ.
Risk notice. This lesson is education, not financial advice. Crypto futures are leveraged and you can lose some or all of the capital you trade with. A stop-loss limits a loss to the level you set; slippage and fast markets can make it larger. Past examples do not predict future results. Every trade you place is your own decision.