
Market structure: swing highs, swing lows and when a trend breaks
Read market structure like a pro: swing highs and lows, higher highs and lower lows, break of structure, change of character, and how to use them in crypto.
In lesson 03 you learned the quick test for a trend: higher highs and higher lows for an uptrend, lower highs and lower lows for a downtrend. Market structure turns that test into a method you can apply on any chart, and it adds the most useful part: how to tell when a trend is starting to fail.
You’ll meet two terms that crypto traders use constantly, break of structure and change of character. They sound technical, but they describe something you can see with your own eyes once you know where to look.
Swing highs and swing lows
A swing high is a peak with lower highs on both sides. A swing low is a trough with higher lows on both sides. You don’t need a formula for this. If you zoom out to the 1-hour or 4-hour chart and squint, the swings are the obvious turning points.
A simple rule keeps you honest: only count a swing if price moved away from it by a meaningful amount, say at least two or three candles of travel. Otherwise every wiggle becomes a swing and the structure turns into noise.
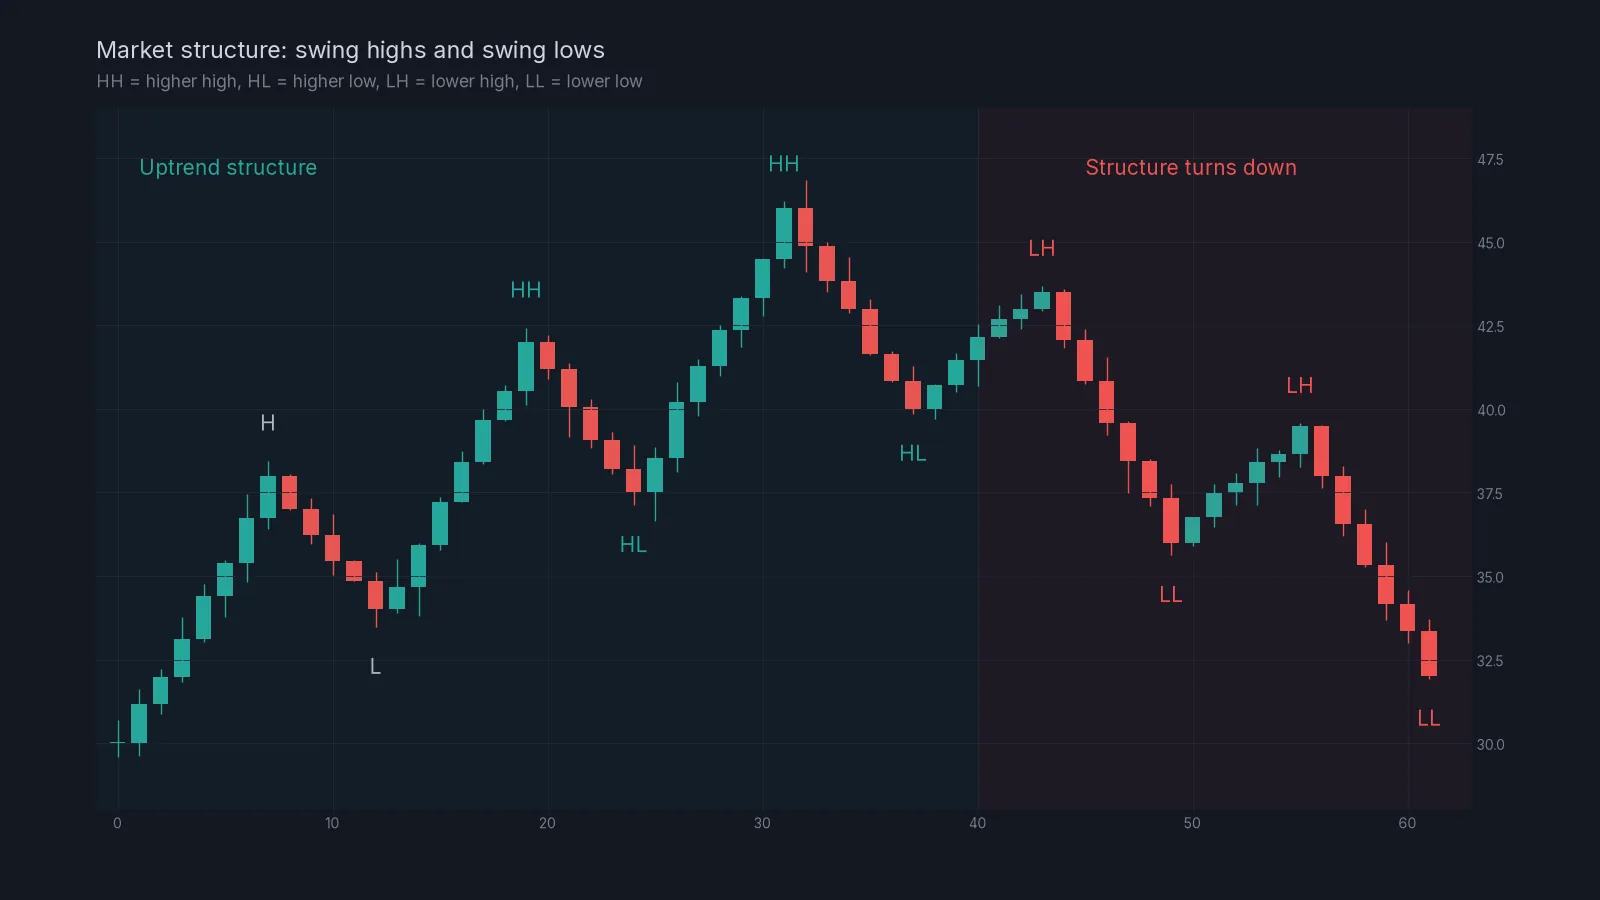
Label each swing as it forms:
- HH (higher high): a peak above the previous peak.
- HL (higher low): a trough above the previous trough.
- LH (lower high): a peak below the previous peak.
- LL (lower low): a trough below the previous trough.
A run of HH and HL is an uptrend. A run of LH and LL is a downtrend. A mix of equal highs and equal lows is a range.
The line in the sand
In an uptrend, the most important level on the chart is the last higher low. As long as price stays above it, the uptrend is intact, however scary the pullbacks look. If price closes below it, the uptrend has a problem.
In a downtrend, the line in the sand is the last lower high. As long as rallies stay below it, sellers are in charge.
This gives you a practical rule for stops and for bias. If you’re looking for longs in an uptrend, a sensible stop sits below the last higher low, because a close below it means your reason for being long has gone.
Break of structure and change of character
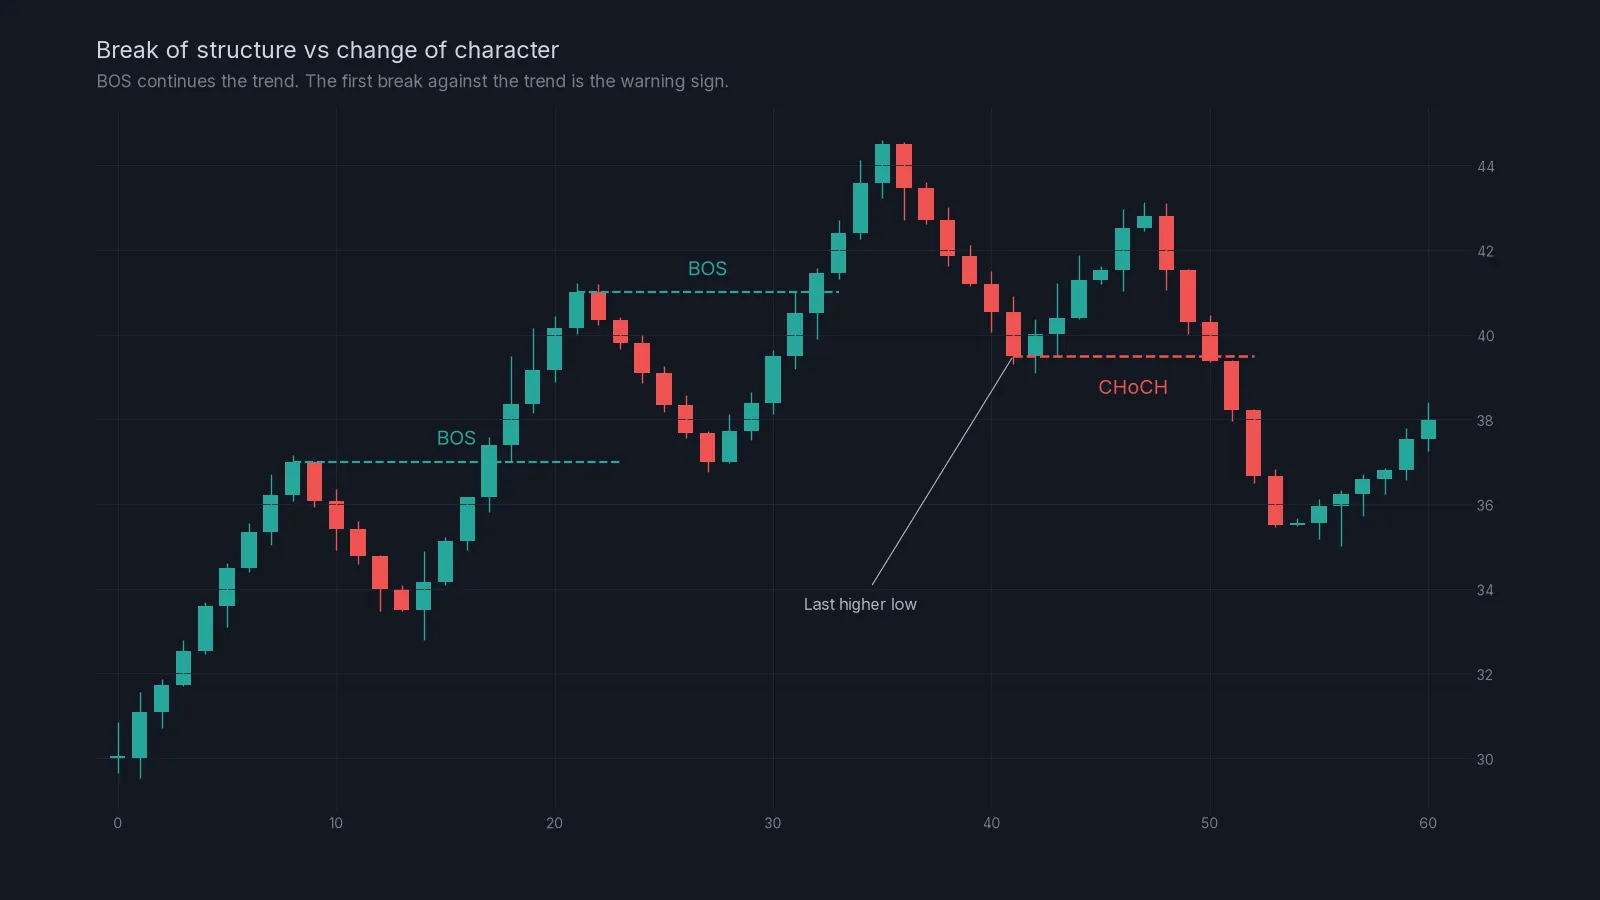
A break of structure (BOS) is a close beyond the last swing in the direction of the trend. In an uptrend, that’s a close above the last swing high. It confirms the trend is continuing.
A change of character (CHoCH) is the first close beyond the last swing against the trend. In an uptrend, it’s a close below the last higher low. It’s the market behaving out of character.
A worked example on a 1-hour SOL chart:
| Swing | Price | Label |
|---|---|---|
| Low | 170.0 | Start |
| High | 177.0 | H |
| Low | 173.5 | HL |
| High | 181.0 | HH, BOS above 177.0 |
| Low | 177.0 | HL |
| High | 184.5 | HH, BOS above 181.0 |
| Low | 179.5 | HL, the line in the sand |
| High | 182.8 | LH, failed to make a new high |
| Close at 178.9 | CHoCH below 179.5 |
At 182.8 the market failed to make a higher high. That’s the first hint. The close at 178.9, below the last higher low of 179.5, is the change of character. Notice what this doesn’t say: it doesn’t say SOL is now in a downtrend. It says the uptrend has been interrupted. Confirmation comes if the next rally makes a lower high below 182.8 and price then breaks below 178.9 again.
Why CHoCH is a warning, not a signal
Many beginners see the first close below a higher low and immediately go short. Sometimes that works. Often it’s a sweep: price dips below the obvious low, triggers the stops of everyone who was long, and resumes the uptrend. You will study that exact pattern in lesson 07 on liquidity sweeps.
So treat a CHoCH as a change of permission. Before it, you were only interested in longs. After it, you stop looking for longs and start watching for a lower high to form. Only then, with a clear level to put a stop above, does a short make sense.
Structure across timeframes
Structure on different timeframes can disagree. The 15-minute chart might show a downtrend while the 4-hour shows an uptrend. That’s normal: the 15-minute downtrend is probably just a pullback inside the bigger trend.
A useful hierarchy:
- Read structure on the timeframe above your planning timeframe. That’s your bias.
- Read structure on your planning timeframe. That’s where you find your swing points and stops.
- Use the lower timeframe only for timing, never for bias.
When the higher and planning timeframes agree, trades with the trend are cleaner. When they disagree, size down or wait.
How to read structure on any chart:
- Open the 4-hour chart and mark the last six swing points.
- Label them HH, HL, LH or LL.
- Write the state: uptrend, downtrend or range.
- Mark the line in the sand: the last HL in an uptrend, the last LH in a downtrend.
- Drop to the 1-hour chart and repeat steps 1 to 4.
- Note whether the two timeframes agree.
- Set an alert at the line in the sand, so you’re told if a change of character happens.
Common mistakes
Counting every wiggle as a swing. Use meaningful swings only. Zoom out if in doubt.
Using wicks for some swings and closes for others. Pick one method for breaks (we use candle closes) and stick to it.
Trading the first CHoCH as a reversal. Wait for a lower high (or higher low) to form first.
Reading structure on the 1-minute chart. Structure there changes every few minutes and tells you very little.
Forgetting levels. Structure and support and resistance work together. A CHoCH right at a major resistance zone carries far more weight than one in the middle of nowhere.
Next lesson
Structure tells you direction. Candles at the right place tell you timing. Continue with lesson 06, candlestick patterns in context. If you want to see how swing highs turn into the liquidity zones on our signal charts, jump ahead to lesson 08, or read how our liquidity short signals work on the home page.
Check yourself
Answer in your head first, then open the answer.
The swings read 40, 46, 43, 49, 45, 48. What is the latest swing high, and what does it suggest?
Show answer
48 is a lower high, below 49. The uptrend has failed to make a new high, which is the first warning sign.
In an uptrend, where is the line in the sand?
Show answer
At the last higher low. A close below it is a change of character.
Price closes above the last swing high in a downtrend. What is this?
Show answer
A change of character, because it breaks structure against the downtrend.
The 4-hour chart is in an uptrend and the 15-minute chart shows a downtrend. Which one sets your bias?
Show answer
The 4-hour. The 15-minute downtrend is most likely a pullback inside the larger uptrend.
Frequently asked questions
What is the difference between BOS and CHoCH?
A break of structure continues the current trend, for example a new higher high in an uptrend. A change of character is the first break against the trend, for example a close below the last higher low.
Should I use wicks or closes to confirm a break?
Closes. Wicks often poke through a level briefly in a sweep. A candle close beyond the swing is a stronger confirmation.
Does market structure work in ranges?
In a range, highs and lows are roughly equal, so there is no clear BOS. That’s useful information in itself: it tells you to trade the edges of the range or wait for a breakout.
Crypto AI Signals sends liquidity shorts, RSI and AI plans to a private Telegram channel, each with an entry and a stop; you place and manage the trade yourself. Try it for 7 days or read the FAQ.
Risk notice. This lesson is education, not financial advice. Crypto futures are leveraged and you can lose some or all of the capital you trade with. A stop-loss limits a loss to the level you set; slippage and fast markets can make it larger. Past examples do not predict future results. Every trade you place is your own decision.