
Candlestick patterns in context: the few that matter and where
Pin bars, engulfing candles, inside bars and dojis explained for crypto traders, with the context rules that decide whether a candle pattern means anything.
Search for candlestick patterns and you’ll find lists of fifty names: three black crows, abandoned baby, tweezer tops. You can learn them all and still lose money, because a candle pattern on its own means very little. What gives a candle meaning is where it forms.
This lesson covers four patterns that appear constantly on crypto charts and spends most of its time on the part the long lists skip: context. You should already be comfortable with support and resistance and market structure, because those are the context.
The four patterns worth knowing
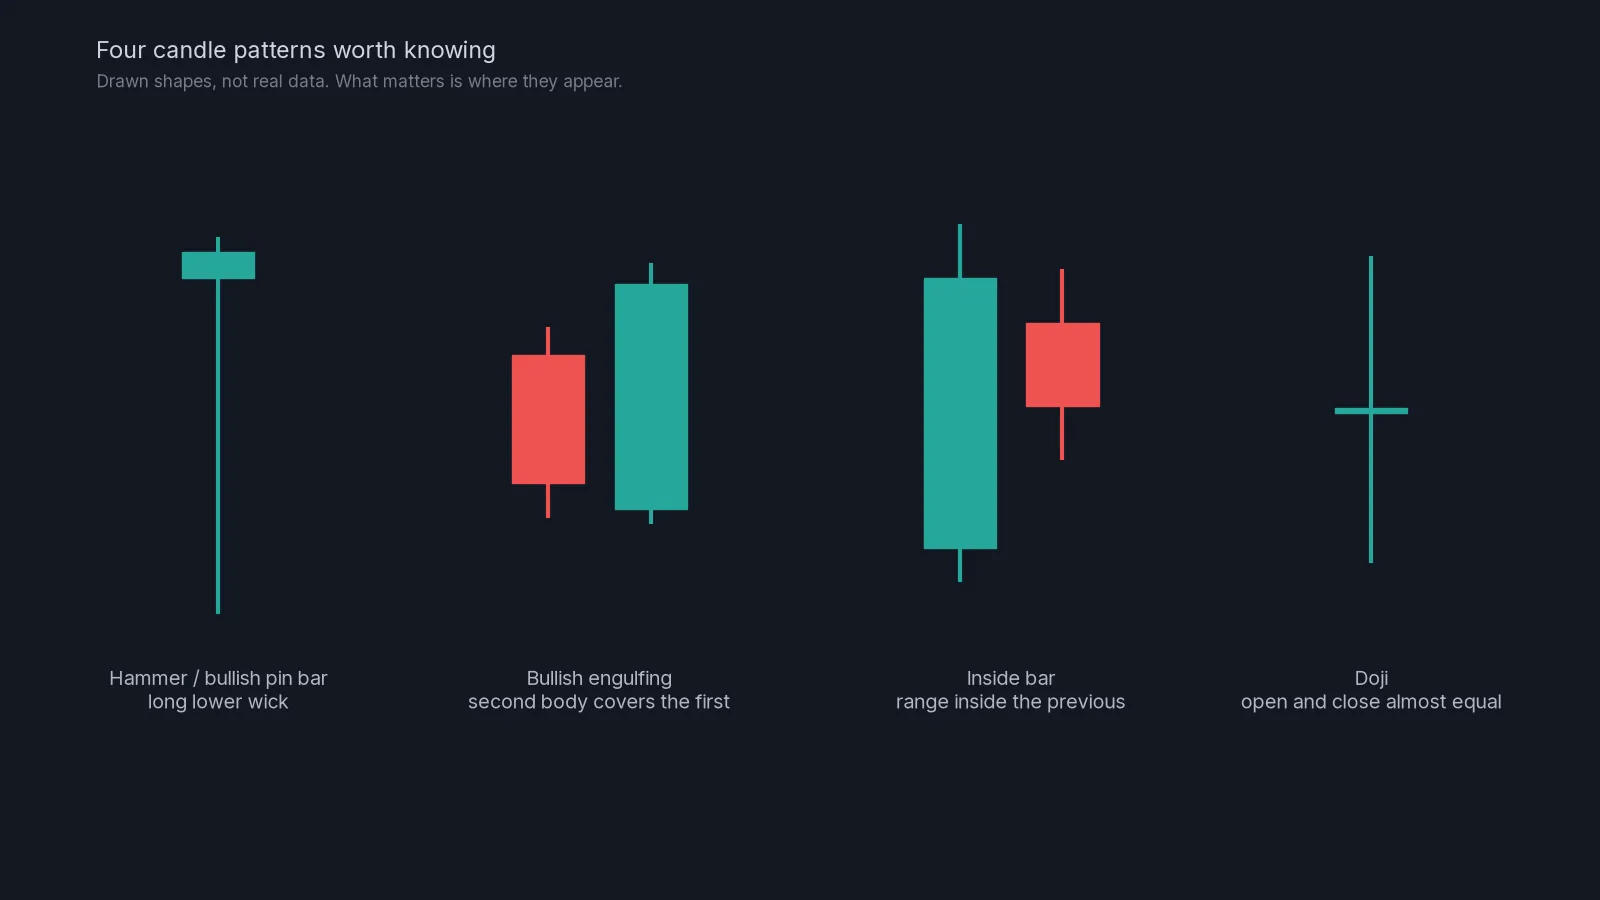
Pin bar (hammer and shooting star)
A pin bar has a small body and one long wick, at least twice the size of the body. A bullish pin bar, often called a hammer, has a long lower wick: price dropped during the candle and buyers pushed it all the way back. A bearish pin bar, a shooting star, has a long upper wick.
What it tells you: a price was tried and rejected. If that price is a known level, the rejection is meaningful. The tip of the wick is also the natural place for a stop, because if price goes back there, the rejection failed.
Engulfing candle
An engulfing pattern is two candles. The second has a body that completely covers the body of the first, in the opposite direction. A bullish engulfing is a red candle followed by a bigger green one.
What it tells you: control changed hands within two periods. The bigger the second candle compared with recent candles, the stronger the statement.
Inside bar
An inside bar is a candle whose whole range, high to low, sits inside the previous candle’s range. It shows a pause: the market is compressing.
What it tells you: a breakout from the pair is coming, in one direction or the other. Inside bars are most useful at a level, where a break of the inside bar’s high or low shows which side won.
Doji
A doji is a candle where the open and close are nearly the same, with wicks on both sides. It shows indecision.
What it tells you: on its own, very little. After a long trend into a major level, a doji can mark the moment the push ran out of energy. In the middle of a range, it means nothing at all.
Context: the rule that matters most
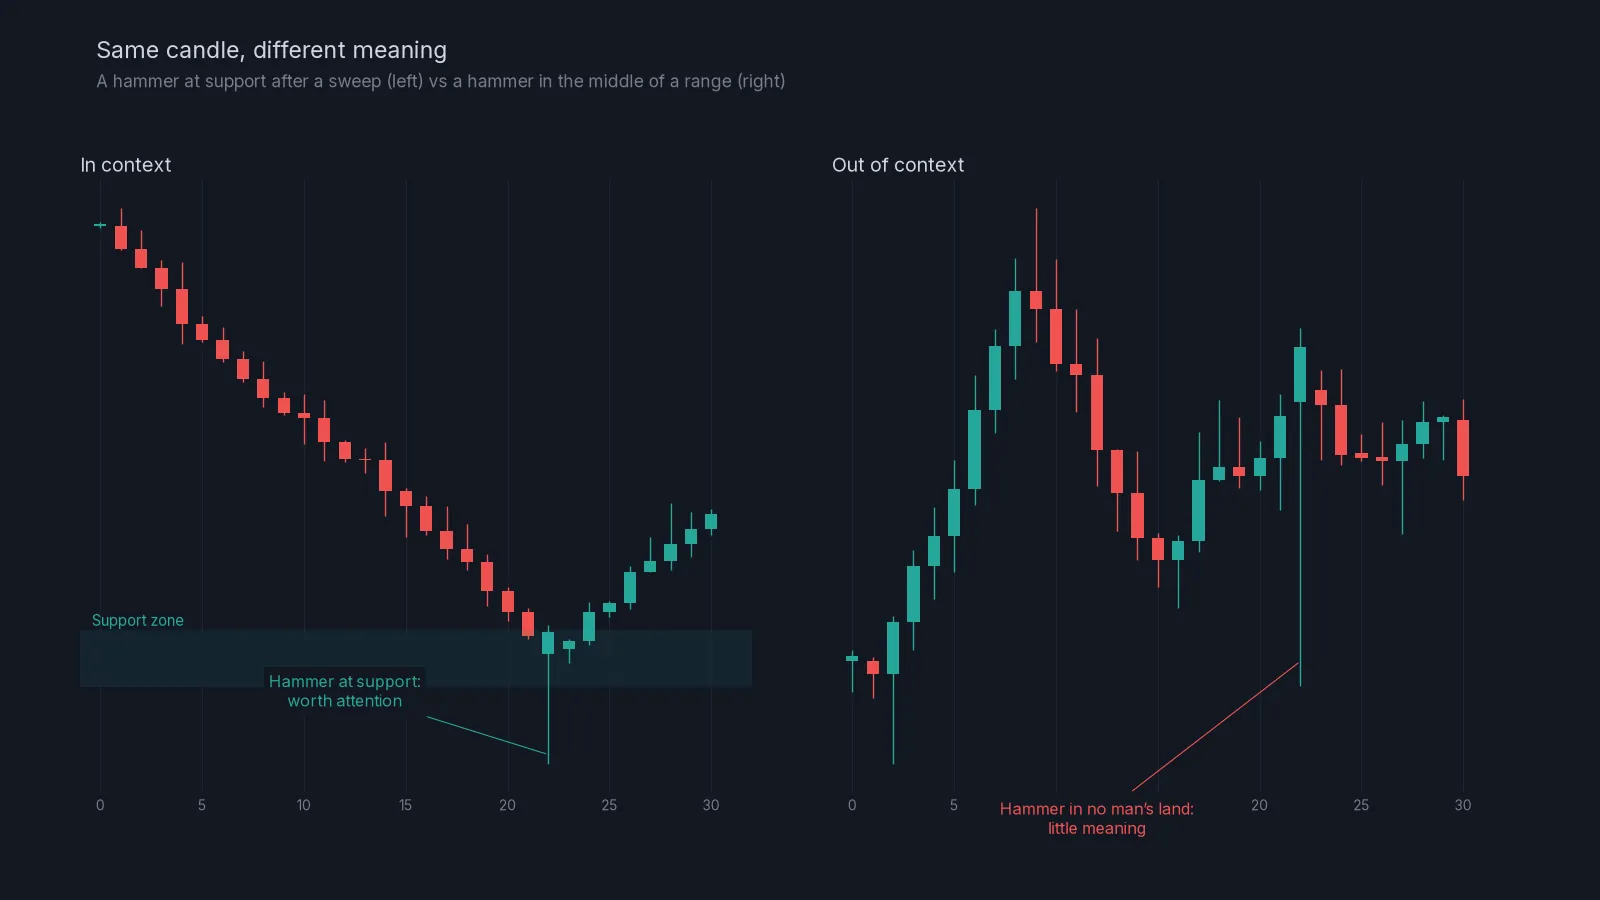
Look at the two hammers in the picture. They are nearly identical. The left one forms at a support zone after a decline, and its wick dips just below the zone before closing back above. That’s a rejection of a level many traders are watching. The right one forms in the middle of a choppy range, at no level, after no particular move. It’s just a candle.
Score any pattern on three questions:
- Location: is it at a level you marked before the candle formed? (Drawing the level afterwards doesn’t count.)
- Size: is it bigger than the average candle of the last twenty or so?
- Direction: does it agree with the higher-timeframe structure, or is it fighting it?
A pattern that scores yes on all three is worth acting on. One yes is worth noting. None is noise.
Confirmation and the close
A candle isn’t a pattern until it closes. A 1-hour candle that looks like a perfect hammer at 45 minutes can turn into a big red body by the close if selling resumes. Wait for the close, always.
Some traders also wait for confirmation: the next candle moving in the pattern’s direction, for example a close above the hammer’s high. Confirmation filters out some failures, at the cost of a worse entry. Neither approach is wrong; choose one and apply it consistently.
A worked example with numbers
BTC has support at 58,200 to 58,500 on the 1-hour chart, tested twice last week. The 4-hour structure is still in an uptrend. Price drops to 58,050, then recovers to close the hour at 58,620, printing a hammer with a 570-point lower wick. The average candle range over the last day was about 300 points.
- Location: yes, at a marked zone, and the wick swept just below it.
- Size: yes, nearly twice the average range.
- Direction: yes, the higher timeframe is an uptrend.
A trader who wanted a long here could place the stop below the wick, say at 57,950, about 1.15% from a 58,620 entry. With a $2,000 account and 1% risk ($20), the position would be $20 ÷ 0.0115, or about $1,740. The pattern didn’t promise anything; it gave a clear place to be wrong, and that’s what made the trade plannable.
Patterns at liquidity
The wick in that example dipped below the support zone before closing back above it. That’s not a coincidence: it is a small liquidity sweep, the setup at the heart of lesson 07. Many of the best pin bars are really sweeps seen on a single candle. Our liquidity short signals look for the bearish version of the same idea: price running above an obvious high and failing.
Before you act on any candle pattern:
- Was the level marked before the candle formed?
- Has the candle closed?
- Is the pattern larger than the recent average candle?
- Does it agree with the higher-timeframe structure?
- Where would the stop go (beyond the wick or the pattern’s extreme)?
- Is the stop distance acceptable, and what position size does it give at your risk?
- If you wait for confirmation, what exactly confirms it?
Common mistakes
Pattern hunting. Scanning charts for hammers anywhere leads to dozens of meaningless trades. Start from the level, then look at the candle.
Acting before the close. The shape can change completely in the last minutes.
Ignoring the trend. A bullish engulfing in a strong downtrend is more often a pause than a reversal.
Stops too tight. Putting the stop inside the wick defeats the point. The wick is where the market already showed you it can go.
Learning too many names. Four patterns plus context will serve you better than fifty patterns without it.
Next module
You’ve finished the price action module. Next comes liquidity, the module that explains our flagship setup: lesson 07, liquidity sweeps and stop hunts. If you’d like to see how a sized trade works in numbers, try the example above in the position size calculator, or see how our signals are sent on the home page.
Check yourself
Answer in your head first, then open the answer.
What makes a pin bar different from an ordinary candle?
Show answer
One long wick, at least twice the size of the small body, showing that a price was reached and then rejected within the candle.
You see a perfect bullish engulfing in the middle of a range, at no marked level. How much weight should it get?
Show answer
Very little. Location is missing, which is the most important part of the context.
A 1-hour hammer is forming with 10 minutes left. Should you enter now?
Show answer
No. Wait for the candle to close. The shape can still change.
Where does the stop usually go on a hammer trade?
Show answer
Below the tip of the lower wick, because a return there means the rejection failed.
Frequently asked questions
Which candlestick pattern is the most reliable?
None is reliable on its own. Pin bars and engulfing candles at well-tested levels, in line with the higher-timeframe trend, tend to be the most useful because they also give a clear stop.
Do candlestick patterns work on all timeframes?
They appear on all timeframes, but they carry more weight on the 1-hour chart and above. On very low timeframes they form constantly and mean little.
Should I wait for confirmation after a pattern?
It’s a trade-off. Confirmation filters out some false patterns but gives a worse entry. Pick one approach and use it consistently so you can judge it over many trades.
Crypto AI Signals sends liquidity shorts, RSI and AI plans to a private Telegram channel, each with an entry and a stop; you place and manage the trade yourself. Try it for 7 days or read the FAQ.
Risk notice. This lesson is education, not financial advice. Crypto futures are leveraged and you can lose some or all of the capital you trade with. A stop-loss limits a loss to the level you set; slippage and fast markets can make it larger. Past examples do not predict future results. Every trade you place is your own decision.