
Academy tool
Position size and stop-loss calculator
Enter your account size, how much you’re willing to lose, your entry and your stop. The calculator works out the position size, the margin at your leverage and whether your liquidation price sits safely beyond your stop. Everything runs in your browser; nothing is sent anywhere.
Calculator
How the calculator works
Position sizing answers one question: how big can this trade be so that, if the stop is hit, I lose exactly the amount I decided in advance? The calculator works it out in four steps, the same ones taught in lesson 01, trading from zero.
- Money at risk = account size × risk %. With $2,000 and 1%, that’s $20.
- Stop distance = the gap between entry and stop. A short at 100 with a stop at 102 has a distance of 2 per coin, or 2%.
- Position size = money at risk ÷ stop distance. $20 ÷ 2 = 10 coins, worth $1,000.
- Margin = position value ÷ leverage. At 5x, $1,000 needs $200 of margin.
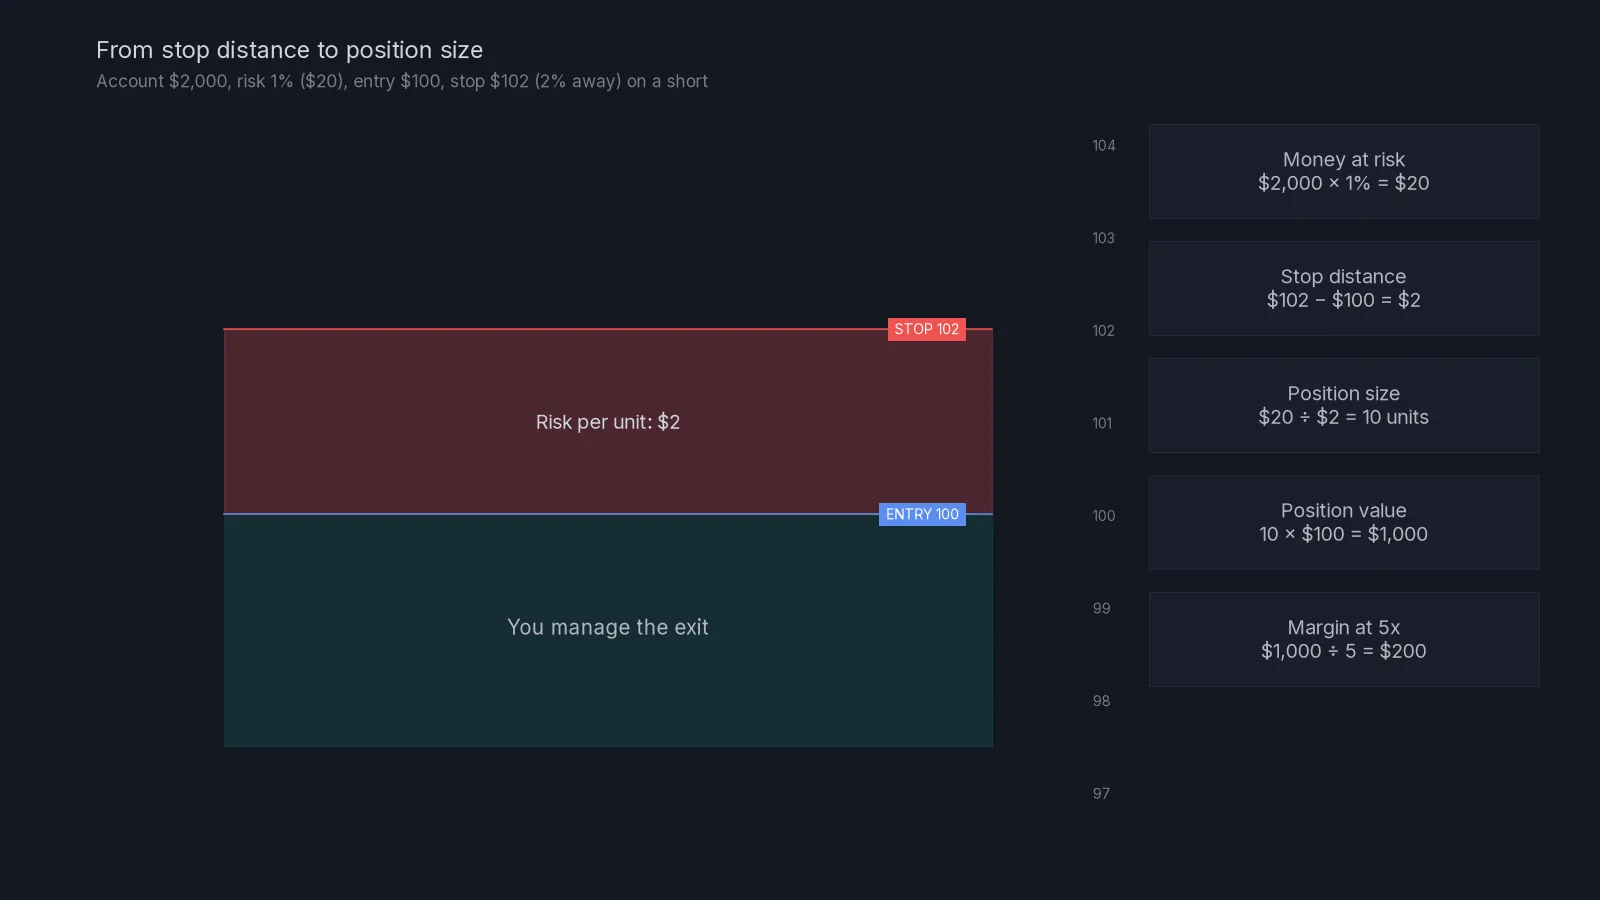
Notice what leverage does and doesn’t do. It changes the margin, the money the exchange holds against your position. It doesn’t change the loss if the stop is hit, because that loss depends only on the position size and the stop distance. That’s why the calculator asks for leverage last, and why you should choose it last too.
Fees
Exchanges charge fees on the full position value, on the way in and on the way out. If you fill in the fee box, the calculator adds the round-trip fee to the loss at the stop and reduces the position slightly so the total stays close to your chosen risk. It starts at zero so the example matches the diagram; 0.05% per side is a typical taker fee on major futures exchanges; check your own exchange’s fee table, and use a lower number if you enter with limit orders that pay the maker fee.
The liquidation check
With isolated margin, a leveraged position is liquidated roughly when the loss reaches the margin. For a long, that’s about (100 ÷ leverage)% below the entry; for a short, about the same distance above it. The calculator subtracts a small maintenance margin (0.5%) to stay on the safe side. If the approximate liquidation price is closer to your entry than your stop, it shows a warning: the exchange would close your position before your stop could fill. Lower the leverage until the warning disappears, with some room to spare. Real liquidation prices depend on your exchange, your tier and the mark price, so treat this as an estimate and always check the exchange’s own figure before you confirm an order.
Worked examples
A liquidity short with a 2% reference stop
Account $5,000, risk 1% ($50). The liquidity level is 64,000, so the entry is 0.20% above it at 64,128 and the reference stop is 2% above the entry at 65,410.56. The stop distance is 1,282.56 per coin. Position size is $50 ÷ 1,282.56, or about 0.039 BTC, worth about $2,500. At 3x leverage the margin is about $833, and the liquidation price is roughly 33% above entry, far beyond the stop. This is the setup explained in lesson 08, liquidity zones on the 1-hour chart.
The same trade at 50x
Change the leverage to 50 and the margin drops to about $50, which looks attractive. But the liquidation price is now only about 1.5% above entry, inside the 2% stop. The calculator flags it. The trade wouldn’t lose $50 at the stop; it would be liquidated first, with the liquidation fee on top. Same position, same idea, worse outcome.
A long at support
Account $3,000, risk 0.5% ($15). Entry 58,620 with a stop under a hammer’s wick at 57,950, a distance of 670, or 1.14%. Position size is $15 ÷ 670 = 0.0224 BTC, about $1,312. That’s the example from lesson 06 on candlestick patterns, with a smaller risk.
How much should you risk per trade?
Many traders use between 0.5% and 2% of their account per trade. The lower end makes losing streaks, which every method has, much easier to survive: ten losses in a row at 1% leaves you down about 10%, while ten losses at 5% leaves you down about 40%, and a 40% drawdown needs a 67% gain just to get back. If you are new, start at 0.5% to 1% until you have a record of at least fifty trades. The full reasoning is in our lesson on position sizing and the 2% reference stop.
What the calculator doesn’t know
- Slippage. A stop becomes a market order when triggered, and in a fast market it can fill worse than its price. Real losses can be a little larger than shown.
- Funding. Perpetual futures charge or pay funding, usually every eight hours. Holding for days adds to the cost.
- Exchange rules. Minimum order sizes, step sizes and risk tiers vary. Round the position down to what your exchange accepts.
The calculator is an educational tool, not financial advice. It does the arithmetic; the decision to trade, and how to manage the exit, stays with you. New to the terms used here? The crypto trading glossary defines each of them, and the Academy teaches them in order. If you’d like trade plans with the entry and stop already worked out, our signal licenses start with a 7-day trial.
Frequently asked questions
Does leverage increase my risk?
Not if your position size comes from your stop. The loss at the stop depends on position size and stop distance. Leverage only changes the margin and moves the liquidation price closer to your entry, which matters if it gets close to your stop.
Why is my position bigger than my account?
With a tight stop, the position needed to risk 1% can be worth more than your whole account. That’s normal on futures, where leverage covers the difference. What matters is that the loss at the stop is still 1%, and that the liquidation price is well beyond the stop.
Is my data saved or sent anywhere?
No. The calculation runs entirely in your browser and nothing you type leaves the page.