
Liquidity sweeps and stop hunts: what they are and how to read them
What a liquidity sweep or stop hunt is, why price runs equal highs and lows, how to tell a sweep from a real breakout, and how to plan around one in crypto.
You place a stop just above a clear high. Price spikes up, takes your stop by a few dollars and then collapses in the direction you expected. It feels personal. It isn’t. You’ve just seen a liquidity sweep, one of the most common events on any crypto chart, and once you understand why it happens you can stop being its victim and start planning around it.
This lesson builds on support and resistance and market structure. It’s also the foundation of our flagship signal type, so if you follow our liquidity shorts, this is the lesson that explains what they’re waiting for.
Where liquidity collects
In trading, liquidity means orders waiting to be filled. Some of the biggest clusters are not limit orders but stop orders, and they sit in very predictable places.
Think about who has orders above a clear swing high:
- Short sellers who sold below the high, with stop-losses just above it. Those stops are buy orders.
- Breakout traders with buy-stop orders just above the high, waiting to join a breakout. Both kinds of order are buys. (Take-profit orders from shorts sit lower down, near support.)
So just above an obvious high there is a pile of buy orders that will all trigger if price touches them. Below an obvious low, the mirror image: long traders’ stops and breakdown sell orders.
The more obvious the level, the bigger the pile. And nothing is more obvious than equal highs or equal lows: two or three peaks at the same price, which every trader on the planet can see.
Why price goes there
A large trader who wants to sell a big position has a problem. Selling into a quiet market moves the price against them before they’re finished. They need lots of buyers at once. The cluster of buy stops above an equal high is exactly that: a sudden wave of buyers.
You don’t need to believe in a villain hunting your stops personally. The mechanics alone are enough. Price tends to travel towards the places with the most resting orders, because that’s where large trades can be filled. When it gets there, the stops trigger, buyers rush in, a big seller fills, and once the buying is used up, the price has nothing holding it up.
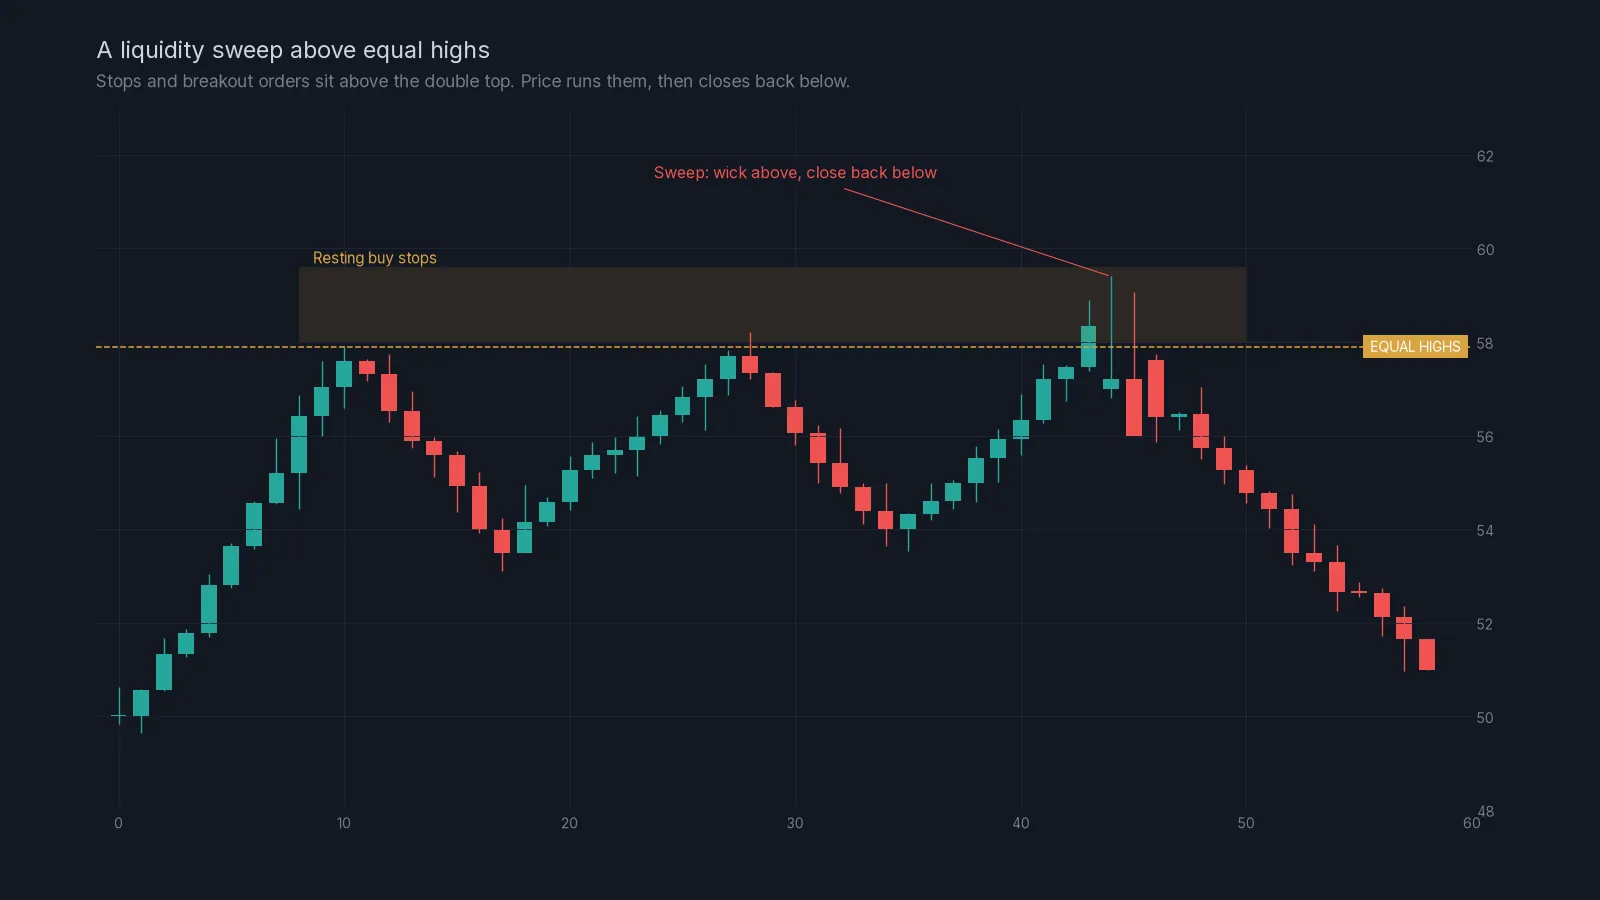
Anatomy of a sweep
A clean sweep of highs usually has four stages:
- Build-up: two or three highs form at nearly the same price. Stops pile up above.
- Approach: price drifts back towards the highs, often on falling volume.
- Sweep: one candle pushes through the highs, frequently with a volume spike as stops trigger. It wicks above.
- Failure: the same candle, or the next one, closes back below the highs. The move above didn’t hold.
The key is stage 4. Price trading above the high isn’t the signal. Price failing to stay above it is.
Sweep or breakout?
The difficulty is that a real breakout starts exactly the same way. Price goes through the level in both cases. The difference shows up afterwards.
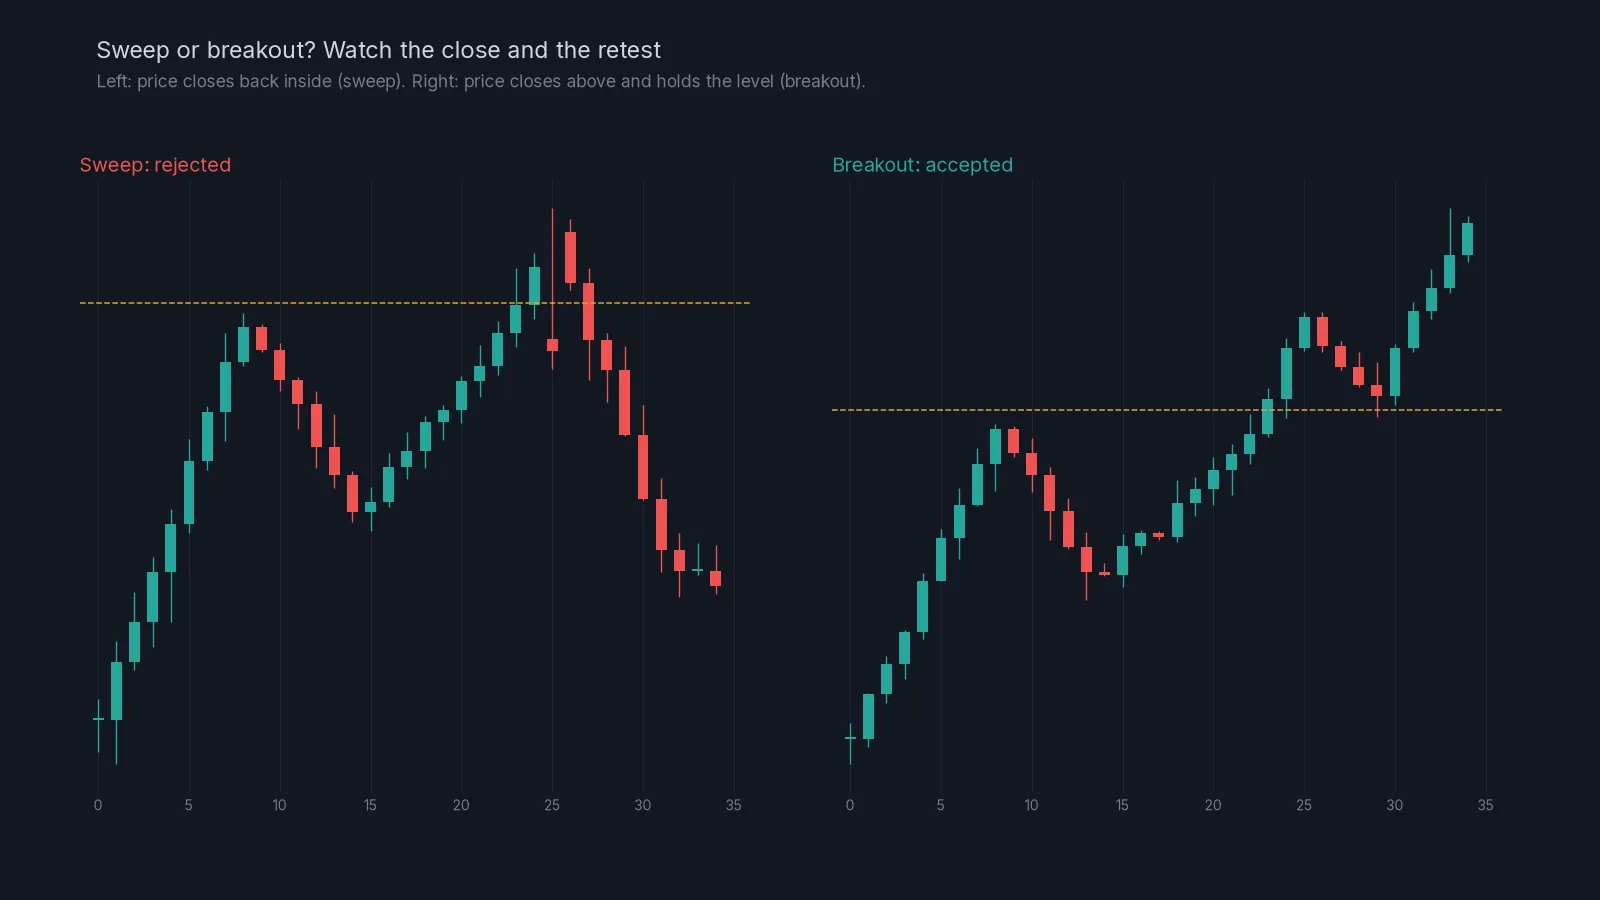
| Clue | Sweep (rejected) | Breakout (accepted) |
|---|---|---|
| Close of the move | Back below the level | Above the level |
| Wick | Long upper wick | Small wick, solid body |
| Next candles | Move away from the level, downward | Hold above, retest from above |
| Volume | Spike, then quickly drying up | High and staying elevated |
| Higher timeframe | Often at resistance in a range or downtrend | Often with the higher-timeframe trend |
None of these clues is certain on its own. Together they shift the odds. And when in doubt, the close on your planning timeframe is the most important one.
A worked example
On the 1-hour BTC chart, three highs have formed at 64,180, 64,220 and 64,200 over two days. The 4-hour chart is ranging between 60,000 and 64,500. That’s a cluster of equal highs near the top of a range: classic liquidity.
Price climbs back and one candle reaches 64,610, about 0.6% above the highs, then closes at 64,050. Volume on that candle is three times the day’s average. The next candle closes at 63,780.
A trader planning a short here has several choices. Our approach, covered fully in lesson 08, is to plan the entry in advance at 0.20% above the level (about 64,350 here), so the order is waiting when the sweep arrives, with a reference stop 2% above the entry, near 65,640. A 2% stop is wide enough to survive the overshoot of a normal sweep. With a $2,000 account and 1% risk, the position would be $20 ÷ 0.02 = $1,000.
Others wait for the close back below the level and enter on the next candle, accepting a worse price for more confirmation. Both are valid. What isn’t valid is putting a stop 0.1% above the equal highs, where the sweep itself will take it.
Sweeps of lows
Everything above works in reverse below an obvious low. Longs’ stops and breakdown sell orders sit there; price runs them, and if it closes back above the low, buyers often take over. The hammer example in lesson 06 was a small sweep of lows. Our signals focus on sweeps of highs for shorts, but the logic is identical.
A reminder about risk. Sweeps make great stories in hindsight. In real time many of them keep going and turn into breakouts. Every plan in this lesson has a stop for that reason, and the position is sized so that being wrong costs a fixed, small amount.
How to plan around a possible sweep:
- Mark equal highs or equal lows on the 1-hour chart.
- Check the 4-hour structure. Sweeps against the higher-timeframe trend are more likely to fail.
- Decide in advance: enter on the approach with a limit order, or wait for a close back inside.
- Put the stop beyond where an ordinary sweep could reach, not just beyond the level.
- Size the position from that stop, so the loss is fixed.
- Set an alert at the level and leave the chart alone.
- If price closes through and holds a retest, accept that it’s a breakout and don’t fight it.
Common mistakes
Stops exactly at the obvious level. That’s where the sweep is aimed. Give your stop room.
Calling every break a sweep. A real breakout looks like a sweep for the first few minutes. Wait for the close.
Ignoring the trend. Sweeps of highs in a strong uptrend often become breakouts. They work best at the top of a range or in a downtrend.
Chasing after the move. If you missed the sweep and price is already far below, the trade is gone. Entering late puts your stop miles away.
Believing in certainty. Liquidity improves your sense of where price may go. It doesn’t guarantee it goes there or what it does next.
Next lesson
You now know why price runs obvious levels. Lesson 08 shows how we turn that into a specific plan on the 1-hour chart, with zones, entries and stops. After that, lesson 09 clears up how liquidity relates to order blocks. To see a full example from our own signals, read liquidity zones and short setups, or look at the home page for the signal types.
Check yourself
Answer in your head first, then open the answer.
Why do stops collect just above equal highs?
Show answer
Short sellers put their stop-losses there and breakout traders place buy stops there, because the level is obvious to everyone.
Price trades above the high and closes above it, then holds a retest. Sweep or breakout?
Show answer
Breakout. The close above and the held retest show the market accepted the higher price.
Your short has a stop 0.1% above clear equal highs. What’s the problem?
Show answer
An ordinary sweep will trigger it. The stop sits right where the resting orders are, which is where price is likely to travel.
Equal highs form at the top of a 4-hour range. Does that make a sweep more or less likely to fail than in a strong uptrend?
Show answer
More likely to fail, which is what a short wants. At the top of a range, sweeps are more often rejected; in a strong uptrend they more often become breakouts.
Frequently asked questions
Is a stop hunt the same as a liquidity sweep?
Yes. Both describe price moving through a level where stop orders cluster, triggering them, and often reversing afterwards.
Are stop hunts market manipulation?
Usually they’re simply mechanics. Large orders need a lot of the other side to fill, and stop clusters provide it. You don’t need to assume anyone targets your personal stop.
What timeframe is best for spotting liquidity?
The 1-hour chart is a good balance. Equal highs and lows there are visible to many traders, while still forming often enough to trade.
Can I avoid being swept?
You can reduce it by placing stops beyond the obvious level, with room for an overshoot, and sizing down to keep the risk the same.
Crypto AI Signals sends liquidity shorts, RSI and AI plans to a private Telegram channel, each with an entry and a stop; you place and manage the trade yourself. Try it for 7 days or read the FAQ.
Risk notice. This lesson is education, not financial advice. Crypto futures are leveraged and you can lose some or all of the capital you trade with. A stop-loss limits a loss to the level you set; slippage and fast markets can make it larger. Past examples do not predict future results. Every trade you place is your own decision.