
How liquidity zones work for short setups, with a marked chart example
Where liquidity builds above price, why sweeps happen, why we enter 0.20% above the level, and a walk-through of a marked BTCUSDT liquidity short.
Most of the plans we send are liquidity shorts. They’re also the plans people ask about most, usually some version of: “Why short into strength? Isn’t that how you get run over?”
Sometimes it is. The point of a liquidity short isn’t that price can’t go higher. It’s that a specific area above price is likely to attract a push, that the push is often fuel rather than a breakout, and that the trade has a clear place where it’s wrong. This post explains each of those pieces, then walks through a marked BTCUSDT example.
What “liquidity” means on a chart
Every resting order is liquidity. For a short setup, the orders that matter sit above price:
- Stop-losses from shorts. Traders who sold a lower high usually put their stop just above it. Those stops are buy orders waiting to fire.
- Breakout buys. Traders waiting for “a break of the high” leave buy-stops a little above it.
- Liquidation levels. Leveraged shorts get force-closed above certain prices. A liquidation is a market buy.
These orders cluster around obvious places: swing highs, equal highs, the top of a range, a round number. On the 1h chart you can usually see them as levels that price has rejected two or three times. That’s what we mark as a liquidity zone.
Why price goes looking for it
Large orders need someone on the other side. A big seller can’t dump size into a thin book without moving price against themselves. A cluster of buy-stops above a high is the opposite: a pool of guaranteed buyers. Push price into it, the stops fire, and the seller gets filled against that buying.
That’s the mechanism behind a sweep. Price trades above a level, triggers the orders resting there, and then fails to hold once that fuel is used up. On a chart it looks like a wick through the high and a close back below it.
It doesn’t always play out. Sometimes the move above the level is real demand, price accepts higher, and the next level up becomes the target. That’s why every zone in our plans has its own stop, and why the stop matters more than the entry.
Why the entry sits 0.20% above the level
If the stops are sitting just above the high, the worst place to sell is exactly at the high. You’re early, you’re in front of the fuel, and you take the full squeeze.
So we put the entry 0.20% above the marked liquidity level. The idea is to be filled during the sweep, after a good part of the resting orders have triggered, rather than before it. If price never trades that far, you’re not filled and there’s no trade. Missing a setup costs nothing. Selling too early into a squeeze costs a stop.
The reference stop sits 2% above entry. That gives the sweep room to overshoot, which it often does, without leaving the risk open-ended. We go into the sizing side of that number in stop-loss sizing for signal traders.
Multiple zones on one plan
Price rarely respects one level cleanly. A plan will often list two or three zones at different distances from price, for example about 3%, 5% and 7% above. Zone 1 is the nearest liquidity. Zone 2 sits higher, beyond zone 1, and only comes into play if price sweeps straight through the first.
Each zone is a separate trade with its own entry and its own stop. You don’t have to take all of them. Some traders take only zone 1 at normal size. Some skip zone 1 and wait for the deeper zone, which often has a better reaction but fills less often. What we’d avoid is treating zone 2 as a place to “average down” on a losing zone 1 trade without having sized for both in advance.
A marked example: BTCUSDT on the 15m
Here’s the sample plan that sits on our homepage. It’s an illustration of how a liquidity short is marked, drawn on real BTCUSDT 15-minute futures data. It isn’t a live signal or a performance claim.
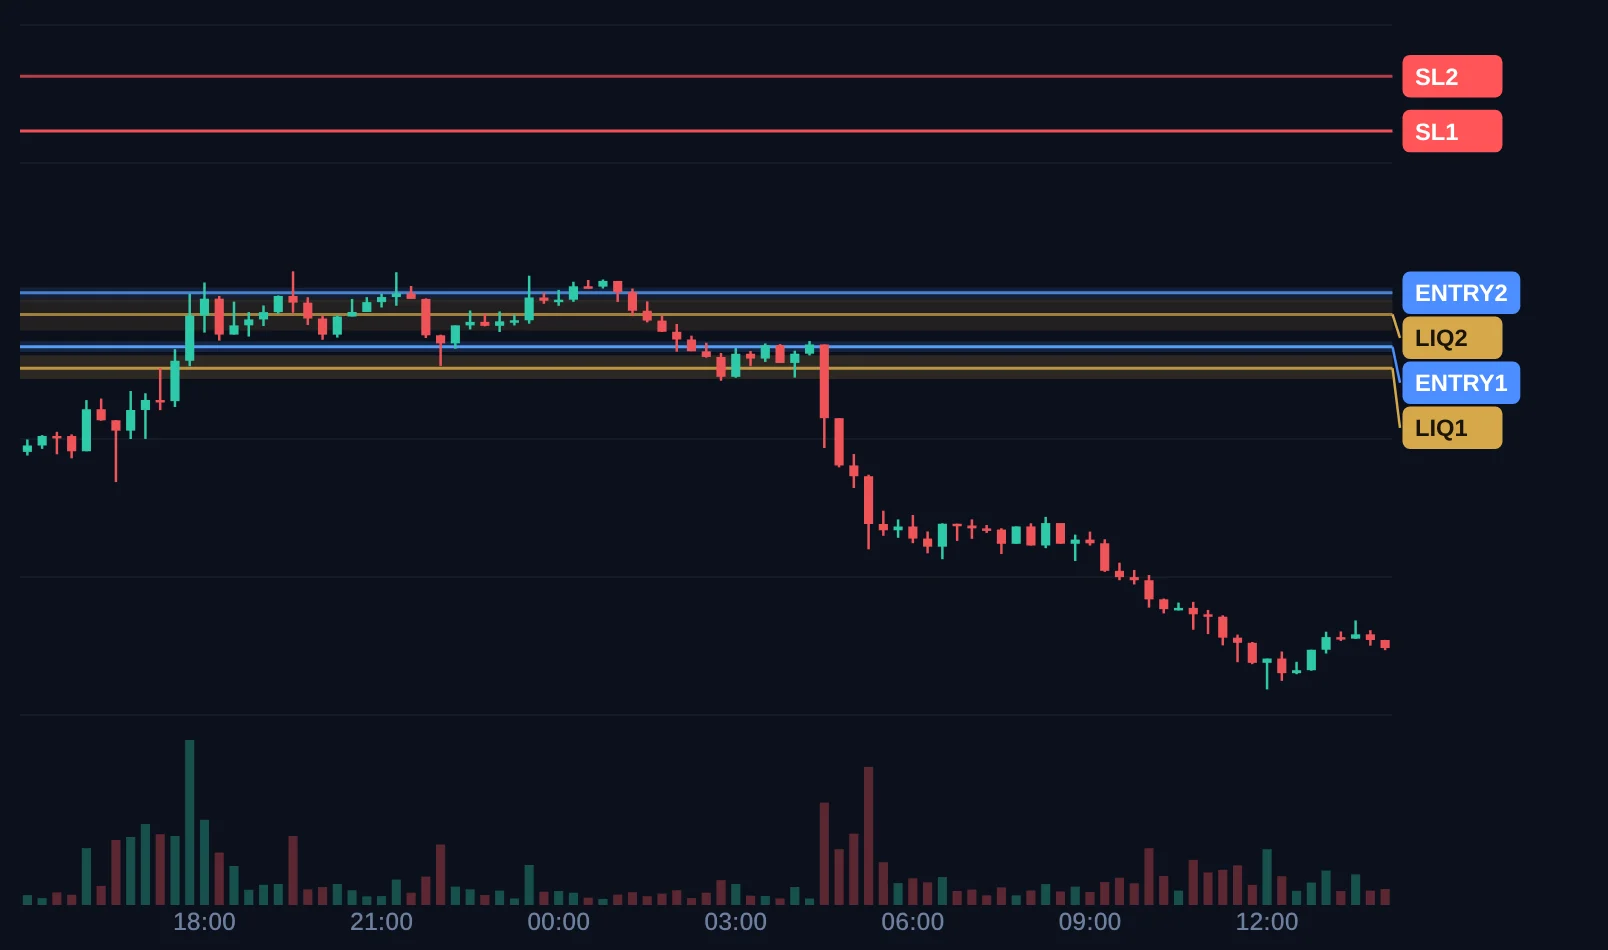
The plan read:
| Zone | Liquidity | Entry | Stop |
|---|---|---|---|
| Zone 1 | 84,118 | 84,286 | 85,972 |
| Zone 2 | 84,538 | 84,707 | 86,401 |
You can check the offsets yourself. 84,118 plus 0.20% is 84,286. 84,286 plus 2% is 85,972. Same arithmetic for zone 2.
What happened, step by step
The plan went out at 17:45 Helsinki time, with price already pressing into zone 1. Both entries filled within half an hour, and by 19:30 the high was 84,875, a little above the zone 2 entry. Then price spent most of the night chopping around both entries. That’s the uncomfortable part of a liquidity short: you’re filled, price isn’t going your way yet, and every green candle looks like the breakout.
What it didn’t do was get near the stops. The night’s high stayed more than a full percent under SL1. Around 04:30 price broke down through the range on the biggest red candle of the session and kept going. By midday it was trading roughly 3% below the zone 1 entry.
In this sample the two zones are close together, about half a percent apart. That happens when liquidity is stacked tightly around one high. On other days the zones are spread much wider, which changes how you’d split size between them.
How you might have managed it
There’s no target on the plan, so the exit was yours. A few reasonable choices:
- Take a third off at the first clean break of the range low, move the stop on the rest to entry.
- Trail the stop above each new lower high on the 15m.
- Close everything at a fixed multiple of the risk you took, for example when the trade is up as much as the stop would have cost.
None of these is the “right” answer. They give different results on different days. What they have in common is that you’d decided on one before the trade went your way.
When liquidity shorts fail
It’s worth being clear about the bad days, because they’re the ones that cost money.
Trend days. When the market is in a strong uptrend, liquidity above price gets taken and price simply keeps going. Zone after zone fails. If you’ve been stopped on zone 1 and zone 2 in the same direction on the same day, that’s information.
News and listings. A big headline can move price through every level on the chart in minutes. Slippage can push a stop fill past the stop price.
Acceptance above the level. A sweep wicks above and closes back below. Acceptance closes above and holds. If the 1h candles start closing above the zone and the old level starts acting as support, the premise of the trade is gone, even if the stop hasn’t been hit yet.
Our RSI and AI plans are paused during crashes, pumps and obvious manipulation. A liquidity short is, by design, a trade against a push into a level, so on a day when the whole market is ripping higher your own read of conditions matters more than usual. Taking zone 1 at half size, or skipping the plan, are both reasonable answers.
A short checklist for each liquidity plan
- Open the 1h chart. Can you see why the level is there?
- Check where price is now. If it’s already well through the entry, skip.
- Decide which zones you’ll take and size each one so a stop costs what you planned.
- Place limit orders and stops together.
- Know your exit approach before you’re in profit.
The idea in one line. Sell slightly above where the stops sit, so the stops become your liquidity instead of your problem, and know exactly where you’re wrong.
If you’re new to signals in general, start with crypto AI signals explained. The homepage shows the same sample with its Telegram post, and the Signal types section covers how RSI and AI plans differ.
See how a plan is marked
Crypto AI Signals sends liquidity shorts, RSI and AI plans to a private Telegram channel, each with an entry and a stop. You place and manage the trade yourself.