
Support and resistance in crypto: how to find levels that matter
How to find, draw and grade support and resistance zones on crypto charts, why wicks break the exact line, and how old resistance becomes new support.
Support and resistance are the first real tool of price action, and the one you’ll use on every chart for the rest of your trading life. The idea is simple: there are prices where the market has repeatedly turned, and it often reacts there again. The skill is in finding the levels that matter, drawing them honestly and knowing what to do when price gets there.
This lesson assumes you can read candles and tell a trend from a range, which was covered in lesson 03.
Why levels work at all
Levels are not magic. They work because traders remember prices and leave orders around them.
Imagine BTC fell to 58,000 three times last month and bounced each time. Traders who bought there and made money want to buy there again. Traders who missed the bounce leave limit buys there. Traders who are short put their take-profit orders just above it. All those orders sitting in roughly the same area act like a cushion. When price comes back, it meets a wall of buying.
The same thing happens in reverse at resistance. And it also explains why levels eventually break: once the orders at a level are used up, there’s nothing left to stop price.
Zones, not lines
The most common beginner mistake is drawing support with a single thin line at an exact price and then being surprised when price trades through it by 0.3% and turns around.
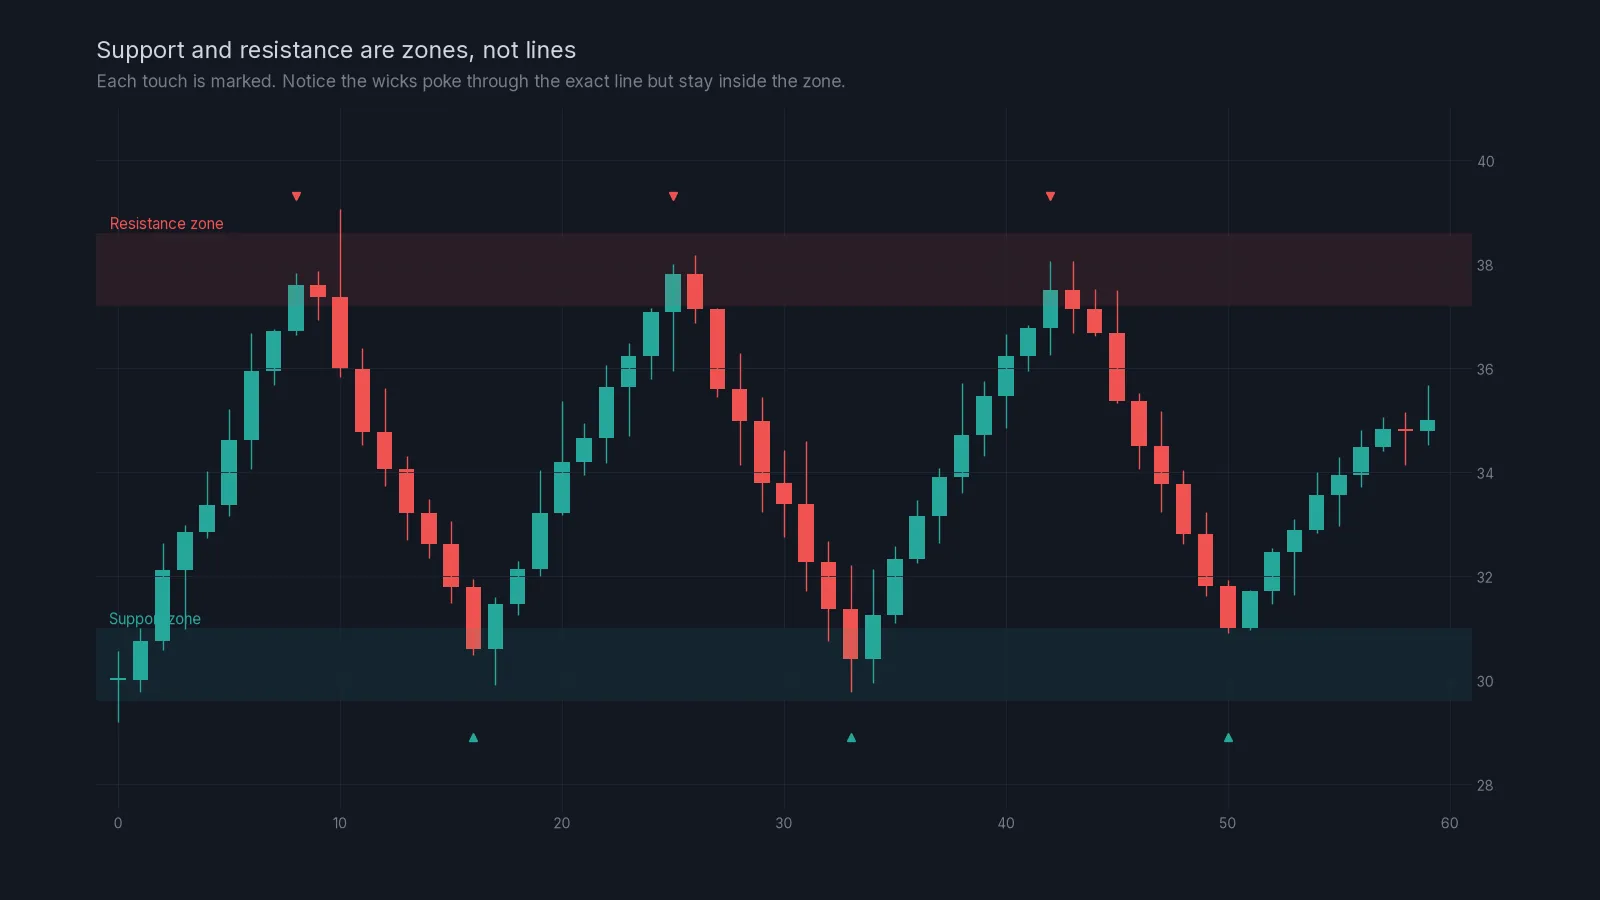
Orders aren’t placed at one price. They’re spread around the level, and in crypto, fast wicks regularly reach a little beyond it. So draw a zone: a rectangle that covers the cluster of wicks and the nearby candle bodies.
How to draw a zone, step by step
- On the 4-hour or 1-hour chart, find a price where the market turned at least twice.
- Mark the most extreme wick at that area. That’s one edge of the zone.
- Mark where most of the candle bodies stopped. That’s the other edge.
- Draw a rectangle between them and extend it to the right.
- If the zone is wider than about 1.5% on a major coin, you are probably merging two levels. Split it or pick the stronger one.
How to grade a level
Not all levels are equal. Score each one on four questions:
| Question | Stronger level | Weaker level |
|---|---|---|
| Which timeframe? | Daily or 4-hour | 15-minute or lower |
| How many clean touches? | Two or three | One, or so many it looks worn out |
| How did price leave? | Sharply, with big candles | Slowly, drifting away |
| How recent? | Within the last few weeks | Many months ago, with no tests since |
A level that scores well on all four is worth planning around. One that scores badly on most is just a line on a chart.
A note on touches: more isn’t always better. The first and second tests of a level tend to be the strongest. Each test uses up some of the orders resting there, and a level that has been hit five or six times is often close to breaking. That’s not a contradiction; it’s just how orders work. In fact it’s one reason why repeatedly tested highs attract liquidity sweeps, which you’ll study in lesson 07.
Role reversal: when resistance becomes support
When a level breaks properly, it often swaps roles. Resistance that has been broken becomes support, and support that has been broken becomes resistance.
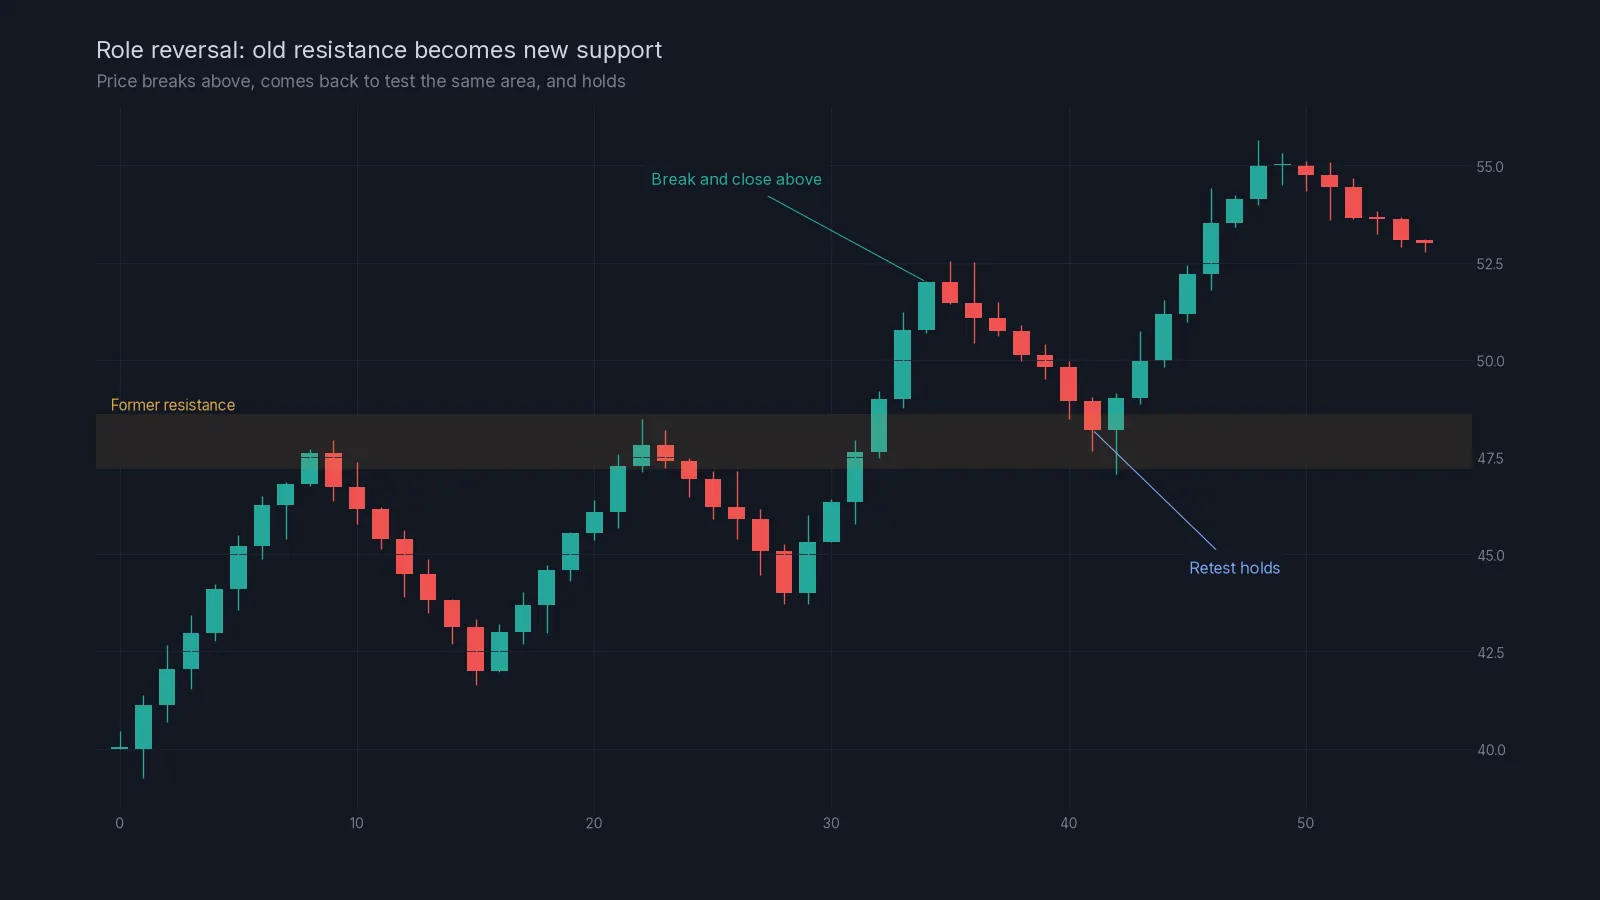
The logic is the same as before. Traders who sold at resistance and watched it break are now losing. Many want to get out at break-even, which means buying when price comes back to their entry. Traders who missed the breakout want to buy the retest. All of that buying sits at the old resistance.
A worked example. ETH has failed three times at 3,400 over two weeks. Then a 4-hour candle closes at 3,460 on strong volume. Two days later price pulls back to 3,410, prints a long lower wick and closes at 3,435. That retest holding is a far better sign of a real breakout than the original candle on its own. If it had closed back at 3,350 instead, the breakout would have failed and the move above would look like a sweep.
Round numbers
Crypto traders love round numbers. 60,000 on BTC, 3,000 on ETH, 100 on SOL. Lots of orders sit around them for no reason other than that humans like neat prices. Treat big round numbers as levels in their own right, especially when they line up with a real level from the chart.
What to do at a level
A level tells you where to pay attention. It doesn’t tell you to trade. When price reaches a zone, there are three things that can happen:
- Rejection: price stalls, prints wicks into the zone and turns. This is where a trade with the level makes sense.
- Breakout: price closes through the zone and holds on a retest. The old level now works the other way.
- Sweep: price pokes through, triggers the orders beyond the zone and snaps back. This is the setup our liquidity signals are built on.
In every case, your stop goes beyond the zone, not on the edge of it. A short at resistance with a stop exactly at the top of the zone will be taken out by ordinary wicks. Give it room, then size the position down to keep the risk the same. The position size calculator does that arithmetic.
Checklist for marking support and resistance:
- Start on the daily chart and mark two or three obvious levels.
- Move to the 4-hour and add the levels price has turned at twice or more.
- Turn each one into a zone covering wicks and bodies.
- Grade each zone on timeframe, touches, departure and age. Delete the weak ones.
- Add any big round numbers close to your zones.
- Write down what you would do at each zone: trade the rejection, wait for a breakout and retest, or ignore it.
- Set alerts on the zones you care about.
Common mistakes
Too many lines. If your chart has fifteen levels, every price is “near a level” and none of them mean anything. Keep three to five.
Drawing levels on the lowest timeframe. 5-minute levels break all the time. Plan on 1-hour and above.
Treating a level as a guarantee. Levels improve your odds slightly. They fail often. That’s why every trade still needs a stop.
Putting the stop inside the zone. Wicks will hit it. Put it beyond the zone.
Ignoring the trend. In a strong downtrend, support breaks more often than it holds. Check the state of the market first, as covered in lesson 05 on market structure.
Next lesson
Levels give you places. Market structure tells you which direction the market favours between those places. Continue with lesson 05, market structure, then lesson 06 on candlestick patterns. If you’d like to see how we turn levels into an actual trade plan, the home page shows the signal types we send.
Check yourself
Answer in your head first, then open the answer.
Why should support be drawn as a zone rather than a single line?
Show answer
Because orders are spread around a level and crypto wicks regularly trade slightly beyond the exact price. A zone captures the area where the reaction actually happens.
A level was tested once on the 15-minute chart six months ago. Is it strong?
Show answer
No. Low timeframe, one touch and very old. It scores badly on almost every question.
BTC breaks above resistance at 62,000, pulls back to 62,100 and holds. What is the old resistance now?
Show answer
Likely support. That’s role reversal, and the held retest is a good sign the breakout is real.
Where should your stop go when you short a resistance zone?
Show answer
Above the zone, with enough room for ordinary wicks, not at the zone’s edge.
Frequently asked questions
How many times should a level be touched to count?
Two clean touches are enough to mark it. Three is often the strongest. After that each new test can weaken the level as the resting orders get used up.
Are support and resistance the same on every exchange?
Almost. Major levels line up across exchanges because arbitrage keeps prices close. Wicks can differ slightly, so chart the exchange you trade.
Do support and resistance work on small altcoins?
They do, but less reliably. Thin order books make wicks longer and levels break more easily. The major coins are better for learning.
Crypto AI Signals sends liquidity shorts, RSI and AI plans to a private Telegram channel, each with an entry and a stop; you place and manage the trade yourself. Try it for 7 days or read the FAQ.
Risk notice. This lesson is education, not financial advice. Crypto futures are leveraged and you can lose some or all of the capital you trade with. A stop-loss limits a loss to the level you set; slippage and fast markets can make it larger. Past examples do not predict future results. Every trade you place is your own decision.