
Technical analysis basics: candles, trends, timeframes and volume
Technical analysis foundations for crypto: reading candles, spotting trends and ranges, choosing timeframes, reading volume and what indicators really do.
Technical analysis is the habit of reading what price has done to make a reasonable guess about what it might do next. It doesn’t predict the future. It helps you find places where the odds lean slightly one way, and places where they don’t lean at all, which is just as useful because it tells you when to do nothing.
This lesson covers the four building blocks: candles, trends, timeframes and volume. Then it explains what indicators really are, so you know what to expect from them. You should already have a clean chart from lesson 02. Keep it open and look for each idea on a real chart as you read.
Reading a single candle
A candlestick shows four prices for one period of time:
- Open: the first trade of the period.
- High: the highest trade.
- Low: the lowest trade.
- Close: the last trade.
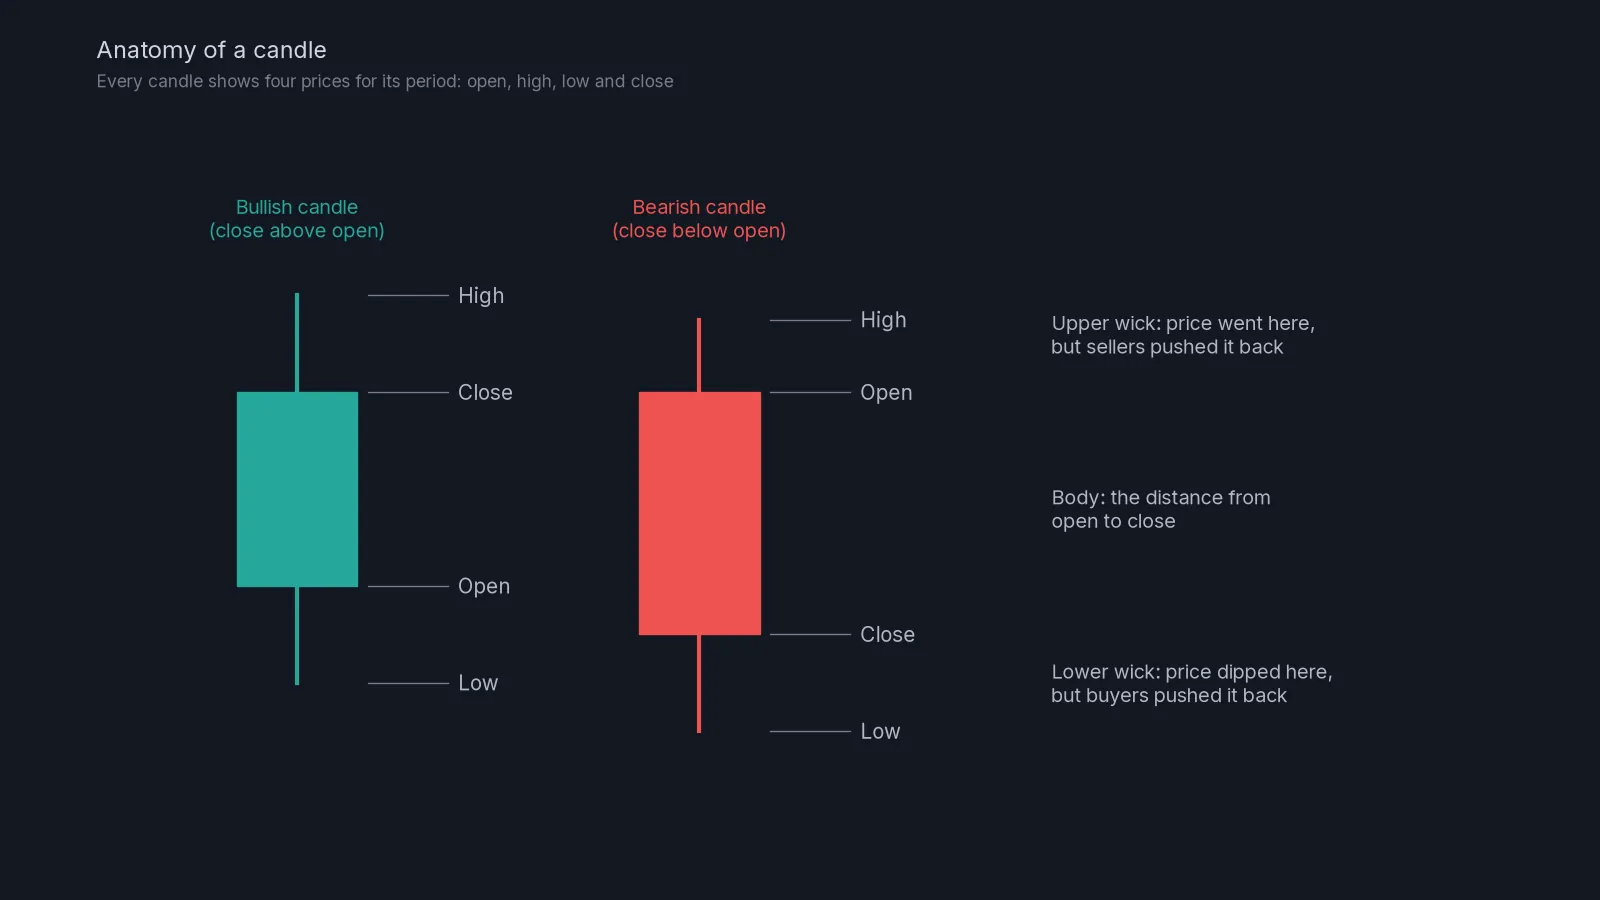
If the close is above the open, the candle is green (bullish). If it is below, the candle is red (bearish). The thick part, the body, covers the distance between open and close. The thin lines, the wicks (or shadows), reach the high and the low.
The most useful habit is to read the wicks. A long upper wick means price went up during the period but sellers pushed it back down before the close. A long lower wick means buyers stepped in after a drop. Wicks are rejected prices, and where they cluster tells you a lot about where the other side is waiting.
Body size matters
Compare the body with the candles around it. A body much bigger than the recent average shows one side clearly in control. A string of tiny bodies shows indecision. A big body that closes near its extreme (a green candle closing near its high) is a stronger statement than one that gave back half of its move before the close.
A candle is only a summary
A single 1-hour candle can hide a lot. A green candle with a long lower wick might have dropped 2% in the first twenty minutes and recovered the rest of the hour. If you want to see that story, drop to a lower timeframe. That’s the link between candles and timeframes, which we come to below.
Trends and ranges
Before you look for any setup, decide what kind of market you’re in. There are only three options.
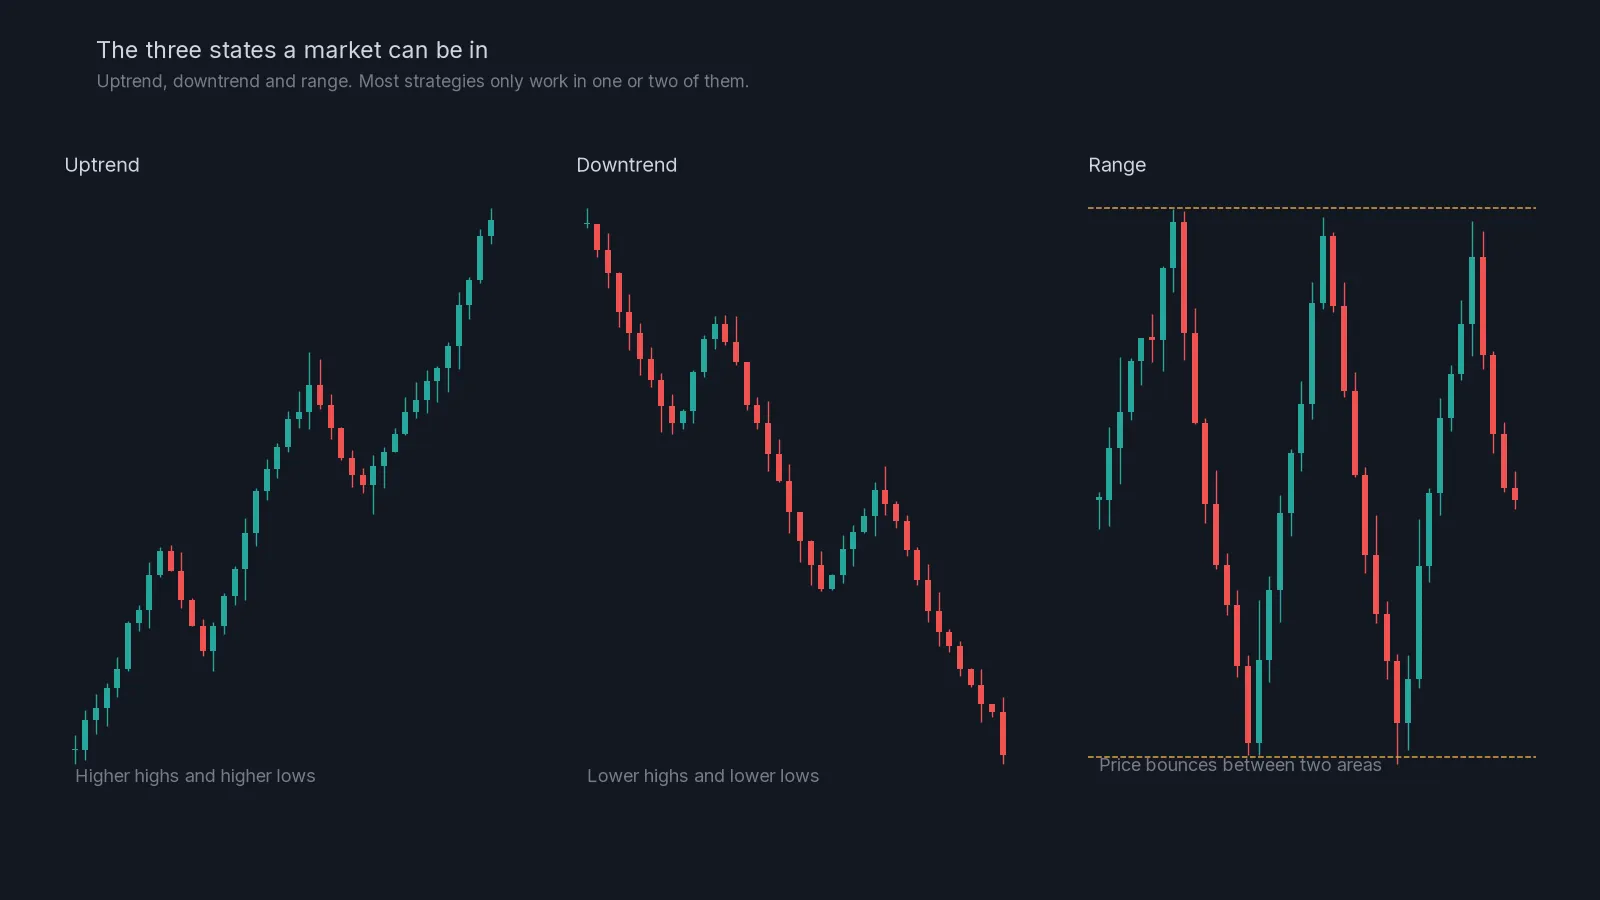
An uptrend makes higher highs and higher lows. Each pullback stops above the previous one and each push goes further. Buyers are in control.
A downtrend makes lower highs and lower lows. Rallies fail below the previous high. Sellers are in control.
A range moves sideways between a ceiling and a floor. Neither side is winning for long. Crypto spends a surprising amount of time in ranges, often more than in clean trends.
Why it matters: strategies behave very differently in each state. Buying dips works well in an uptrend and loses money in a downtrend. Fading the extremes (selling near the top, buying near the bottom) works in a range and gets crushed in a strong trend. Our RSI signals are only sent in range-bound conditions for exactly this reason, as lesson 10 explains.
A quick test for trend
Find the last four swing points (local peaks and troughs). If the highs and lows are both stepping up, it’s an uptrend. Both stepping down, a downtrend. Mixed, or roughly level, a range. Lesson 05, market structure, turns this test into a proper method, including how to spot the moment a trend starts to break.
Timeframes and why the bigger one wins
You saw in lesson 02 that one market looks very different on different timeframes. The important rule is that higher timeframes carry more weight. A level on the daily chart was built by many more trades over a longer time than a level on the 5-minute chart. It is seen by more traders and tends to matter more.
A practical way to combine them, often called top-down analysis:
- Daily or 4-hour: what is the overall state? Trend up, trend down or range? Where are the big levels?
- 1-hour: within that picture, where exactly would you act? Mark the zones.
- 15-minute: when price reaches your zone, how is it behaving? Is it slowing, rejecting, or slicing through?
Here’s a worked example. On the 4-hour chart BTC is ranging between 58,000 and 62,000. On the 1-hour chart you mark resistance at 61,800 to 62,000, where price turned twice last week. You decide in advance that you’re only interested in a short there, not in the middle of the range. Then you set an alert and walk away. When price arrives, you look at the 15-minute chart to see whether it is rejecting the zone or breaking through. Three timeframes, three separate jobs.
Avoid timeframe hopping. If the 1-hour chart doesn’t show what you want, it is tempting to flick through timeframes until one does. That’s not analysis, that’s looking for permission. Decide your timeframes before you open the chart.
Volume: the effort behind the move
Volume is the amount traded during each candle. It appears as bars under the chart. Volume doesn’t show direction on its own; it shows how much participation there was.
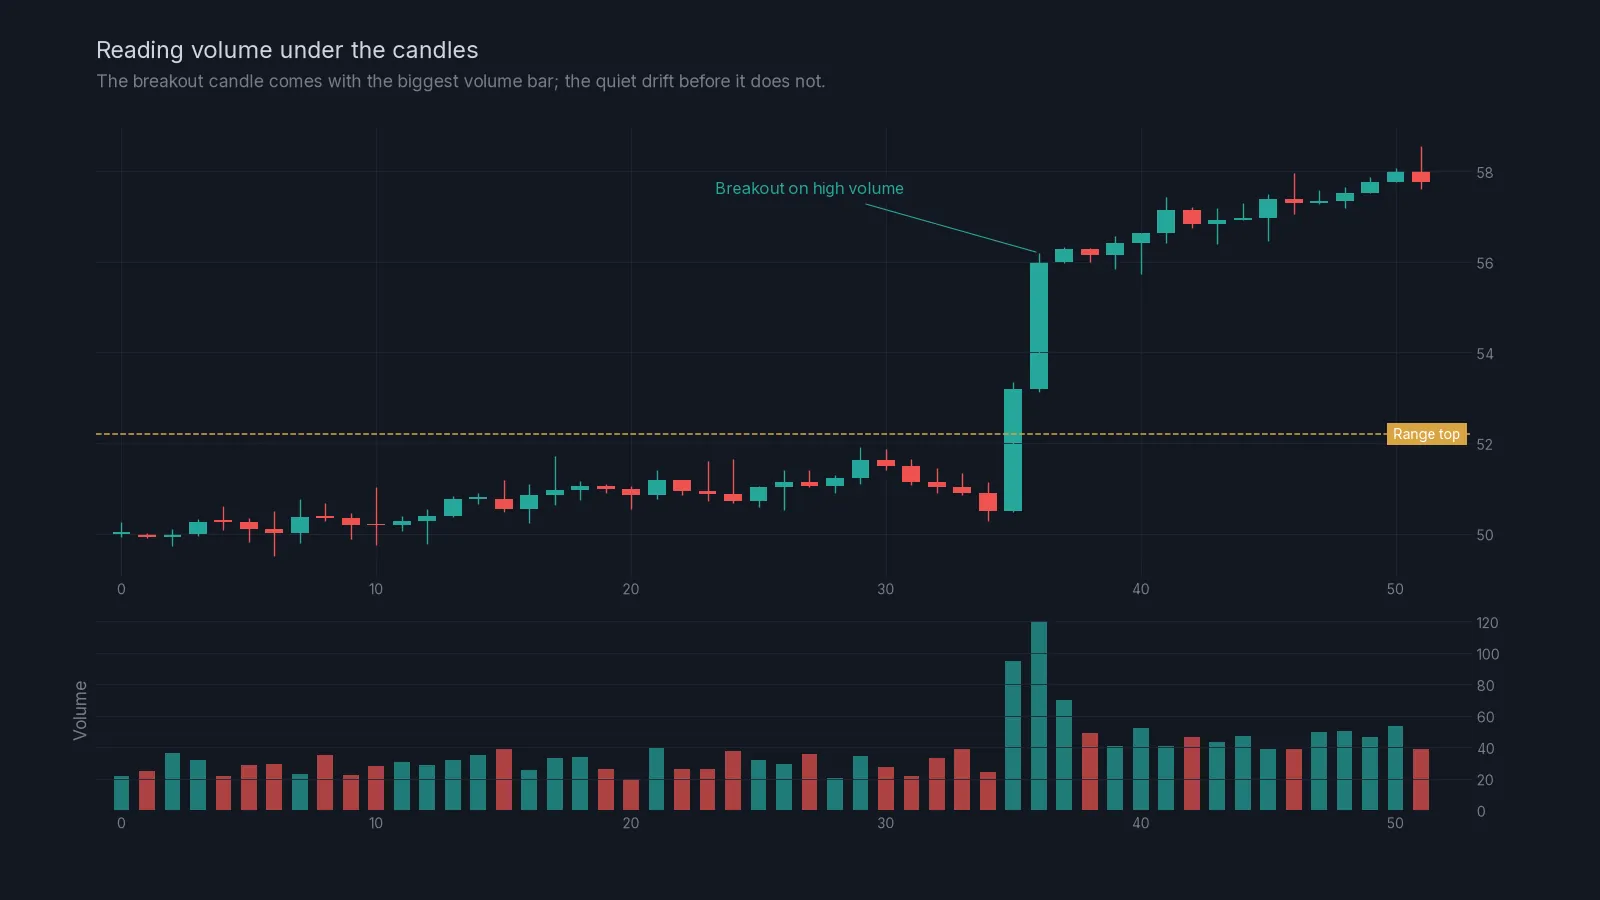
Four simple readings cover most situations:
| Price | Volume | What it suggests |
|---|---|---|
| Breaks a level | High | Real participation. The break is more likely to hold. |
| Breaks a level | Low | Little interest. More likely to fail or reverse. |
| Big wick at a level | High | Heavy fight at that price, often a rejection. |
| Slow drift | Falling | The move is losing energy. |
Two cautions. First, crypto volume differs between exchanges, so compare volume with its own recent average rather than reading the raw number. Second, volume spikes often come from liquidations, when many leveraged positions are force-closed at once. That’s not new conviction; it’s people being pushed out. Those spikes often mark the end of a move rather than the start, which is a theme you’ll see again in lesson 07 on liquidity sweeps.
What indicators really are
An indicator is a formula applied to past price and sometimes volume. A moving average is the average close over the last N candles. RSI compares recent gains with recent losses. Every indicator is built from the same candles you can already see.
That has two consequences. Indicators can’t know anything the candles don’t. And they always lag a little, because they are averages of the past. Their value is in summarising: turning a messy picture into one line you can read quickly.
The main families are:
- Trend indicators, such as moving averages, which smooth price to show direction.
- Momentum indicators, such as RSI, which show how fast price is moving and whether that speed is fading.
- Volatility indicators, such as Bollinger Bands or ATR, which show how wide the recent moves have been.
- Volume indicators, which show participation.
Pick one from the families you actually need, learn it well and use it to confirm what price is already telling you. In this Academy we use volume and RSI and leave the rest alone.
Putting it together: a five-minute chart check
Each time you open a chart, go through this in order:
- State: on the 4-hour chart, is it an uptrend, a downtrend or a range?
- Levels: mark the last clear swing high and swing low, plus any level price has turned at two or more times.
- Location: is price near one of those levels, or in the middle? The middle is usually where you do nothing.
- Candles: at the level, are wicks forming? Are bodies getting smaller, or is price pushing through with big closes?
- Volume: is the move into the level on rising or falling volume?
- Decision: write one sentence. For example: “Range, price at the top, rejection wicks on low volume, interested in a short only with a stop above the range.”
Common mistakes
Reading every candle as a signal. Most candles mean nothing on their own. Location (where the candle forms) matters more than shape. Lesson 06 is built around that idea.
Calling a trend too early. One higher high isn’t an uptrend. Wait for the structure to show itself.
Ignoring the higher timeframe. A perfect 15-minute setup straight into daily resistance is not a perfect setup.
Expecting indicators to predict. They describe. If you treat RSI 70 as “price must fall”, strong trends will teach you otherwise.
Trading in the middle of a range. There’s no edge there, only noise and fees.
Next steps
You have the basic vocabulary now. The next module, price action, builds on it directly, starting with lesson 04, support and resistance. If you’re wondering how this maps onto the charts we send in our signals, the home page has an annotated example of a signal chart.
Check yourself
Answer in your head first, then open the answer.
A candle opens at 100, rises to 104, falls to 99 and closes at 100.5. What colour is it and what does the long upper wick tell you?
Show answer
It’s green, because the close is above the open. The long upper wick shows that buyers pushed price up to 104 but sellers drove it back down before the close.
Price has made the swing points 50, 54, 51, 56, 53. Is this an uptrend, a downtrend or a range?
Show answer
An uptrend: the highs (54, 56) and the lows (51, 53) are both rising.
Why do higher timeframe levels usually matter more?
Show answer
They are built from more trading over a longer period and are watched by more traders, so more orders tend to sit around them.
A breakout above resistance comes on the lowest volume of the day. How should you treat it?
Show answer
With suspicion. Low-volume breakouts fail more often. Wait for a close and a retest, or look elsewhere.
What do all indicators have in common?
Show answer
They’re calculated from past price (and sometimes volume), so they summarise and lag rather than predict.
Frequently asked questions
Does technical analysis work in crypto?
It’s widely used, which is partly why it works at certain levels: many traders watch the same highs and lows, so orders gather there. It doesn’t predict the future, and it works best combined with strict risk control.
What timeframe should a beginner use?
Start with the 4-hour chart for the big picture and the 1-hour chart for planning. Very low timeframes such as 1 minute are noisy and push you into too many trades.
Do I need to learn chart patterns like head and shoulders?
Not to start. Trend, levels, candles and volume cover most of what you need. Classic patterns are really combinations of those building blocks.
Which is better, candlesticks or line charts?
Candlesticks, because they show the high and low of each period. The wicks carry a lot of information that a line chart hides.
Crypto AI Signals sends liquidity shorts, RSI and AI plans to a private Telegram channel, each with an entry and a stop; you place and manage the trade yourself. Try it for 7 days or read the FAQ.
Risk notice. This lesson is education, not financial advice. Crypto futures are leveraged and you can lose some or all of the capital you trade with. A stop-loss limits a loss to the level you set; slippage and fast markets can make it larger. Past examples do not predict future results. Every trade you place is your own decision.