
How to use TradingView: a complete walkthrough for beginners
A step-by-step TradingView walkthrough: the screen layout, timeframes, drawing tools, indicators, alerts and saving charts, with a clean setup for crypto.
TradingView is where most crypto traders look at charts, including us. Every signal we send is drawn on a chart that looks a lot like the one you’ll set up in this lesson. The platform has a free plan, runs in a browser and on phones, and has more buttons than anyone needs. This walkthrough shows the ones that matter and skips the rest.
The diagrams below are our own drawings of a typical charting screen, not screenshots, so the exact position of a button on your screen may differ a little. The ideas are the same everywhere. If you haven’t read lesson 01, trading from zero, do that first, because we’ll use words like long, short and stop-loss without explaining them again.
Getting started
Go to the TradingView website, create a free account and open the full chart (usually a button called “Chart” or “Supercharts” in the top menu). You can look at charts without an account, but you need one to save drawings and set alerts. The free plan has limits on the number of indicators per chart and the number of active alerts, and for this whole Academy it’s enough.
One setting to change straight away: the time zone. Click the clock at the bottom right of the chart and choose your own zone. Daily candles then open at the time crypto exchanges use (00:00 UTC), but the times along the bottom match your watch, which avoids a lot of confusion when you compare a chart with a Telegram message.
The screen, mapped
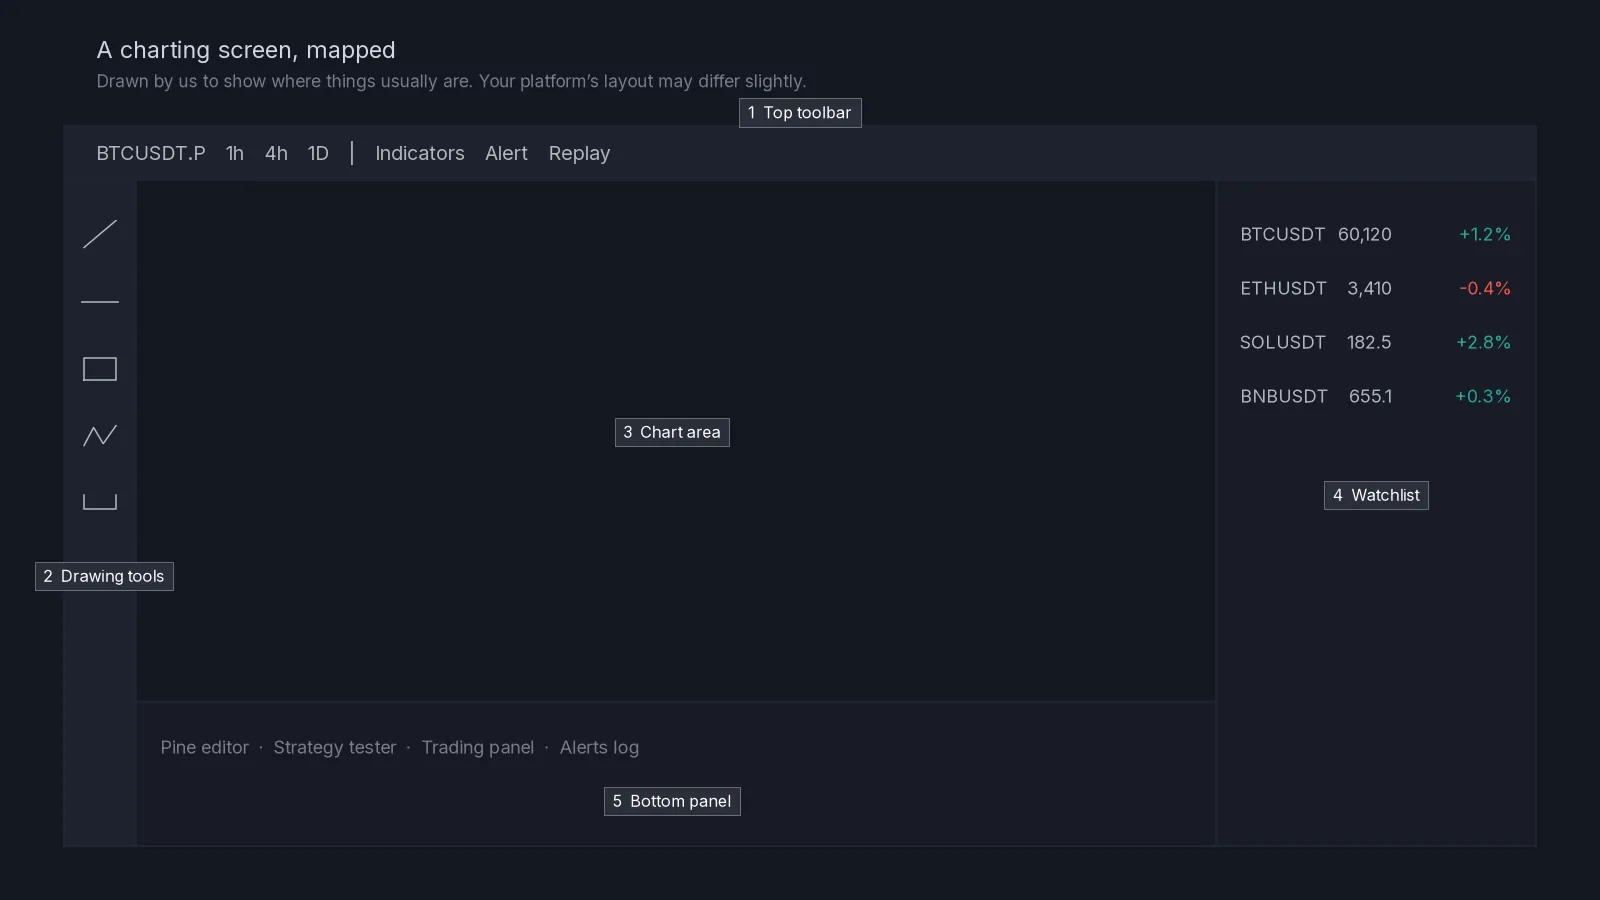
- Top toolbar. The symbol (for example BINANCE:BTCUSDT.P), the timeframe, the chart type, the indicators button, the alert button and the replay button.
- Drawing toolbar on the left. Lines, shapes, measuring tools, text, and the magnet that snaps drawings to candle highs and lows.
- Chart area. Candles, your drawings and the price scale on the right. Scroll to zoom, drag to move back in time, drag the price scale to stretch it.
- Watchlist on the right. Your list of markets, with last price and daily change. Click one to load it.
- Bottom panel. Pine editor, strategy tester, trading panel and alert log. You can ignore it for now.
Choosing the right symbol
The same coin appears many times, once for each exchange and product. For crypto futures you want the exchange’s perpetual contract, which on TradingView is usually marked with “.P” or “PERP”, for example BINANCE:BTCUSDT.P. The spot market is just BTCUSDT. Prices are very close, but wicks can differ slightly, and if you trade futures it makes sense to chart futures from the exchange you actually use.
Timeframes: zooming in and out of time
Each candle covers a period of time. On a 1-hour chart, each candle is one hour; on a 15-minute chart each is fifteen minutes. Changing the timeframe doesn’t change the market, only how much detail you see.
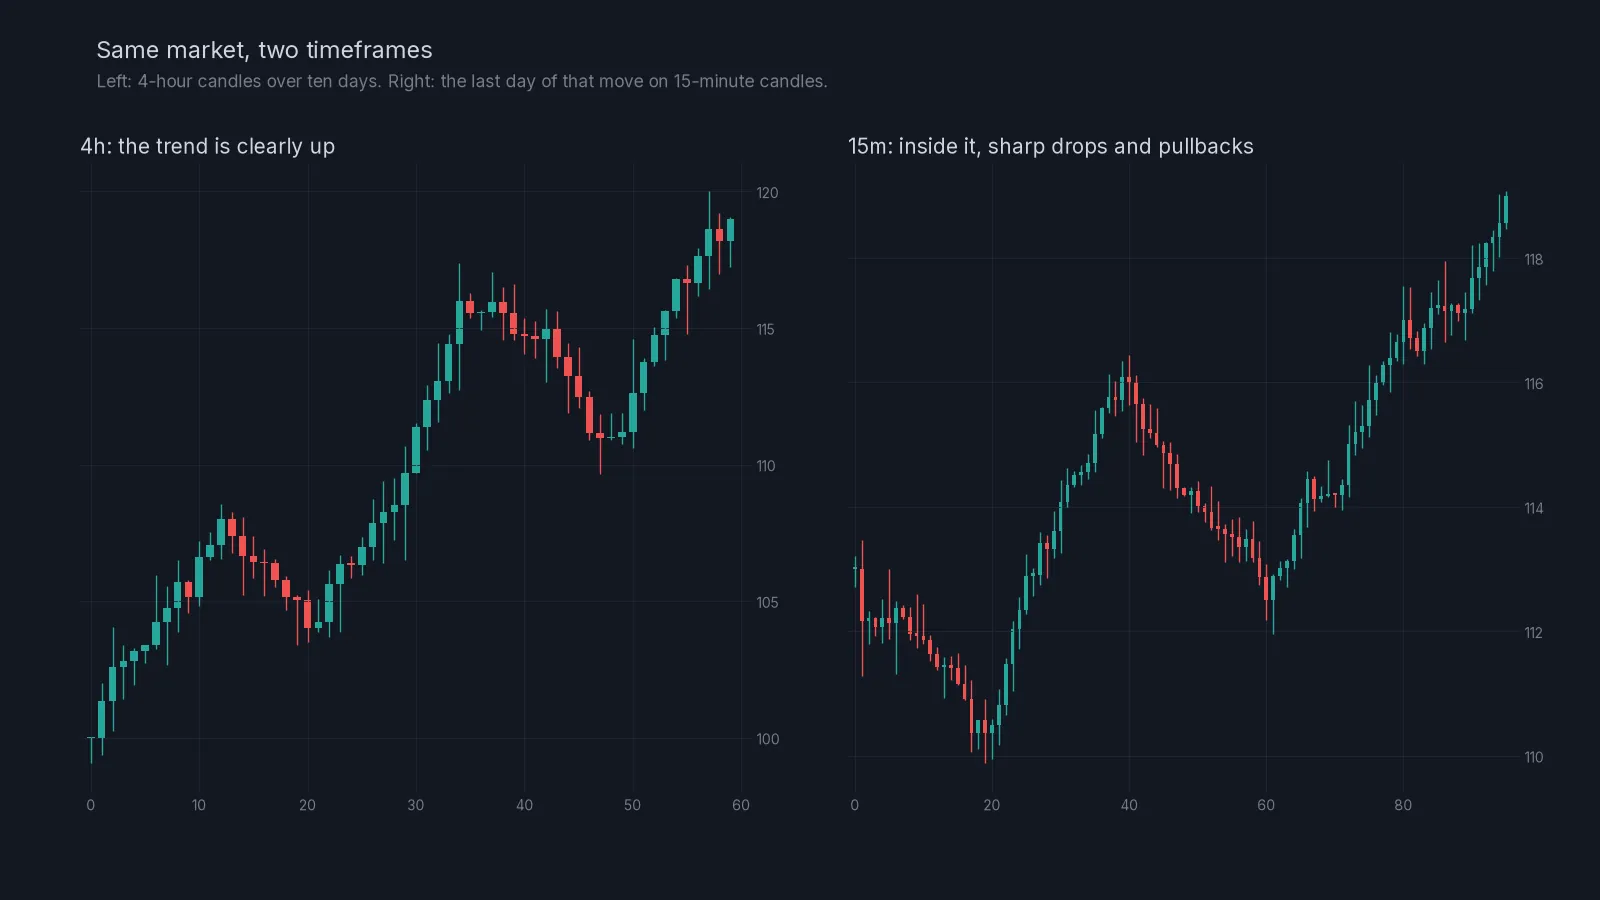
That picture explains a lot of beginner frustration. On the 15-minute chart a drop looks like a crash; on the 4-hour chart it is a small pullback inside an uptrend. Both are true. Which one matters depends on what you’re trying to do.
A simple way to use timeframes is to give each one a job:
| Job | Typical timeframe | Question it answers |
|---|---|---|
| Big picture | 4h or 1D | Is the market trending or ranging? |
| Planning | 1h | Where are the levels I care about? |
| Timing | 15m | Is price reacting at my level right now? |
Our liquidity zones are marked on the 1-hour chart, for reasons covered in lesson 08. Add your three timeframes to the favourites (the star next to each one in the timeframe menu) so they sit on the toolbar as one-click buttons.
Making the chart readable
The default chart is fine, but a few changes make it easier on the eyes. Right-click the chart and open Settings.
- Candles: keep green for up and red for down, and turn off the candle borders if you find them noisy.
- Background: a dark solid background is easier during long sessions.
- Grid lines: make them faint or turn them off.
- Scales: show the countdown to bar close, so you can see how long the current candle has left.
- Status line: keep the OHLC values on, so you can read the open, high, low and close of any candle by hovering over it.
Then save these as your default template (there’s a “Template” button at the bottom of the settings window). Every new chart will open with the same look.
The drawing tools you’ll use most
Horizontal line
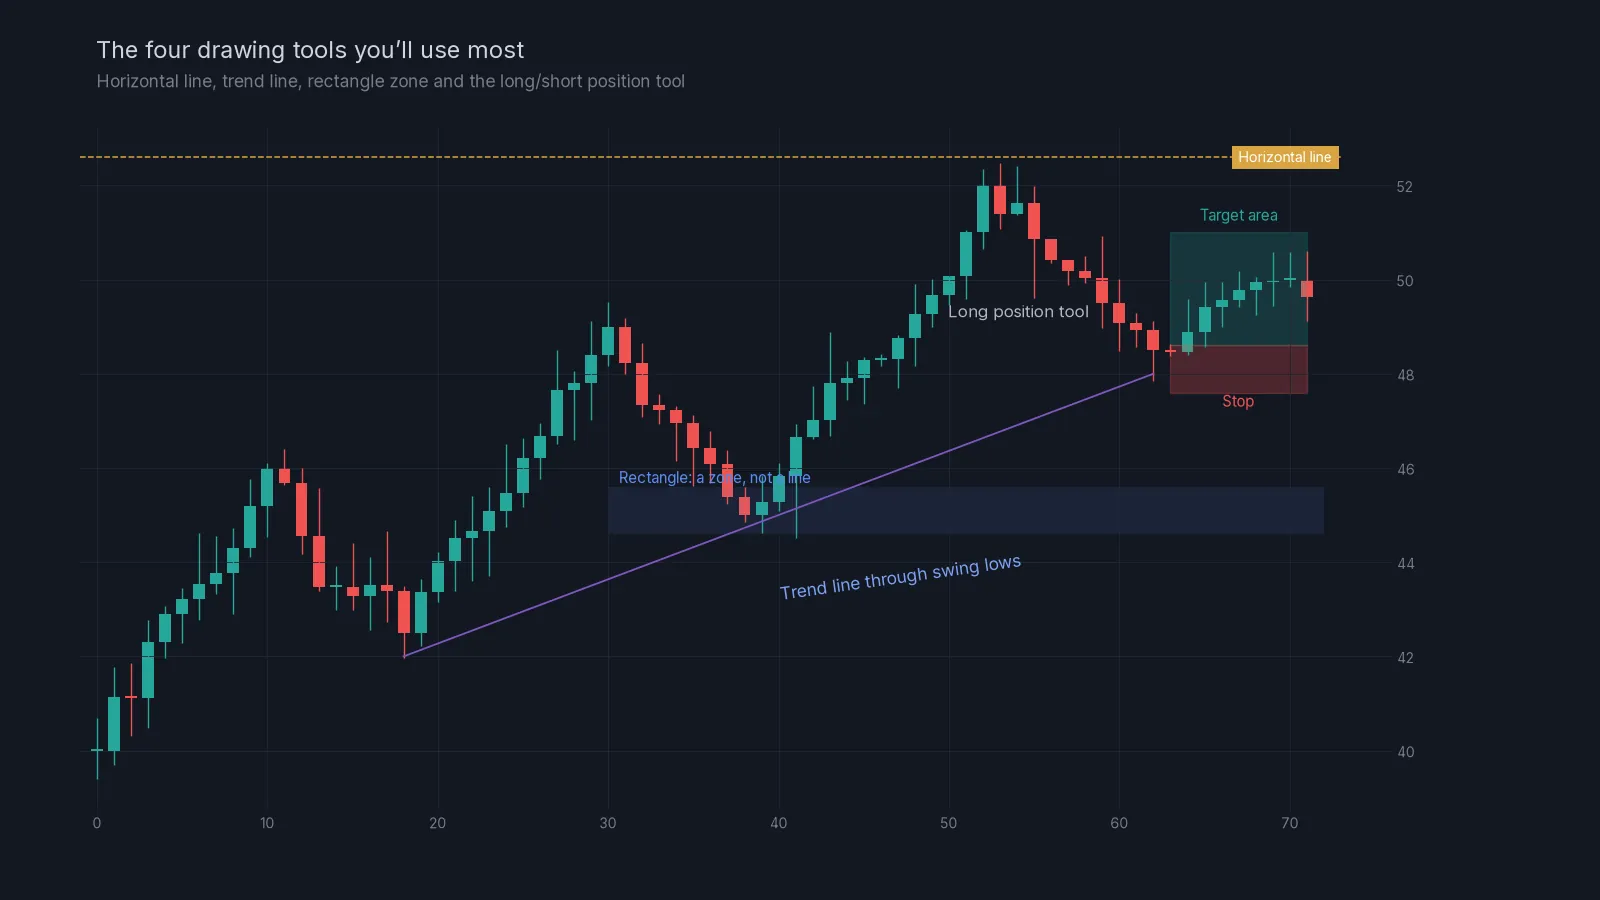
The simplest and most useful tool. Click it, then click on the chart at the price you want. Use it for levels: a previous high, a previous low, a round number. Hold Shift or use the magnet to snap it exactly to a wick. Double-click a line to change its colour or add a text label, for example “LIQ1”.
Trend line
Click two points, such as two swing lows, and the tool draws a line through them. Trend lines are helpful but easy to abuse: you can always find two points to connect. Only draw a trend line where it has been touched at least twice and is clearly visible without squinting.
Rectangle
Support and resistance are areas, not single prices, as you’ll see in lesson 04. A rectangle lets you mark a zone: drag from the top-left to the bottom-right, then right-click and choose “Extend right” so it follows price into the future.
Long and short position tools
This tool draws a planned trade: entry, stop and target, with the risk-to-reward ratio shown on the box. Click at the entry price, then drag the red part to your stop and the green part to your target. Open its settings and enter your account size and risk, and it calculates the position size for you. It is a great practice tool, and the same calculation is in our position size calculator.
Measure
The ruler (or Shift plus click and drag) shows the distance between two points in price, percentage and number of bars. Use it to check things like “how far is my stop from my entry in percent?”
Tidy up. Old drawings pile up fast. Right-click the chart and use “Remove drawings” now and then, or put drawings for each idea in a separate layout. A cluttered chart hides the one line that matters.
Indicators without the clutter
Click Indicators (the “fx” button) and search by name. Each indicator either sits on top of the price (like moving averages) or opens in its own pane below the chart (like RSI and volume).
The temptation is to add many. Resist it. Most indicators are different ways of looking at the same price data, so stacking five of them doesn’t give you five opinions. It gives you one opinion five times and a chart you can’t read. For this Academy you need two:
- Volume, which shows how much traded in each candle. It’s covered in lesson 03.
- Relative Strength Index (RSI), set to length 14. It gets its own lesson in lesson 10.
To change an indicator’s settings, hover over its name at the top of its pane and click the gear. To remove it, click the cross.
Alerts: let the chart call you
Staring at a chart all day is tiring and leads to bad decisions. Alerts solve that. You mark your level once, set an alert, and get a notification when price arrives.
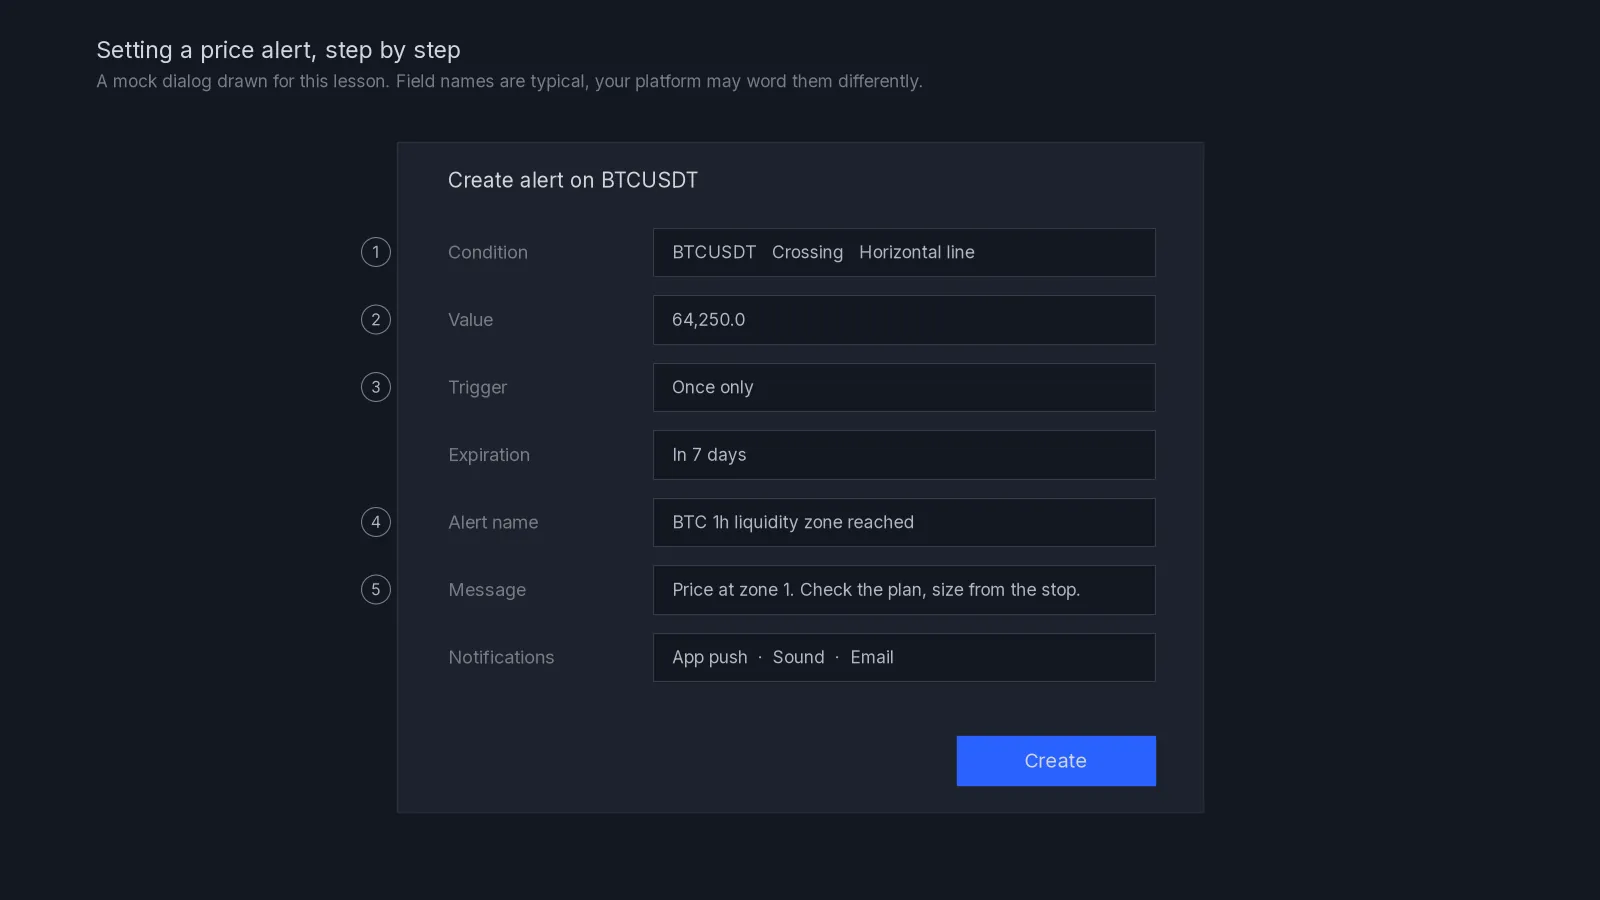
- Condition: choose the symbol and “Crossing”, then either a price or one of your drawn lines. The easiest way is to right-click a horizontal line and choose “Add alert”.
- Value: the price, if you’re not using a drawing.
- Trigger: “Once only” for a planned level. “Every time” will keep firing as price chops around the line.
- Expiration: set a date, so old alerts don’t fire weeks later when the plan no longer applies.
- Name and message: write what you planned. “Price at zone 1. Check the plan, size from the stop.” is far more useful at 3 a.m. than “BTC alert”.
- Notifications: app push is the most reliable. Install the phone app and log in with the same account.
The free plan allows only a small number of active alerts, so delete ones that are no longer relevant.
Saving layouts and using replay
Everything you’ve set up lives in a layout: the symbol, timeframe, drawings and indicators. Use the layout menu at the top right to save it, give it a name like “BTC plan” and open it again later on any device. You can keep separate layouts for different ideas.
The Replay button lets you go back in time, hide everything to the right, and play the chart forward candle by candle. It’s one of the best learning tools there is. Pick a day a few weeks ago, mark your levels without seeing what came next, then press play and watch how price behaved. You’ll learn more in an hour of replay than in a week of watching live charts. Some replay features need a paid plan on certain timeframes; the daily and 1-hour replay are usually enough to practise.
Your first session, step by step:
- Create a free account and open the full chart.
- Set your time zone and a clean dark theme, then save it as the default template.
- Load the futures contract you trade, for example BTCUSDT perpetual.
- Add 4h, 1h and 15m to your favourite timeframes.
- Add volume and RSI(14), nothing else.
- On the 4h chart, mark the last clear swing high and swing low with horizontal lines.
- On the 1h chart, mark one zone with a rectangle and extend it right.
- Set a “once only” alert on one line, with a written message and an expiry.
- Save the layout with a clear name.
- Use replay on an older date and practise marking levels before you press play.
Common mistakes
Charting the wrong market. Spot charts and futures charts are close, but not identical. Chart what you trade.
Too many indicators. If the price candles take up less than half of the screen, remove something.
Drawing levels on every timeframe at once. Lines from the 1-minute chart are noise on the 1-hour chart. Draw on the timeframe you plan on.
Alerts with no message. An alert that just says the name of a coin tells you nothing about what to do.
Trusting the position tool blindly. It doesn’t know your exchange’s fees or your leverage. Check the numbers against the position sizing lesson until you understand them.
Next lesson
You now have a clean chart and the tools to mark it up. Lesson 03, technical analysis basics, teaches you what to look at on it: candles, trends, ranges and volume. If you already receive our signals, the setup in this lesson is all you need to redraw any of our zones on your own chart and set alerts at them. If you don’t, the home page explains what a signal looks like.
Check yourself
Answer in your head first, then open the answer.
You want to plan a trade on the 1-hour chart. Which timeframe would you check first for the big picture?
Show answer
A higher one, such as the 4-hour or daily chart, to see whether the market is trending or ranging before you plan on the 1-hour.
Why is “Once only” usually the better trigger for a price-level alert?
Show answer
Because “Every time” keeps firing whenever price crosses back and forth around the line, which buries the first, useful alert under repeats.
Which tool shows you the risk-to-reward of a planned trade on the chart?
Show answer
The long or short position tool. It draws entry, stop and target and shows the ratio.
You have added six indicators and the chart is hard to read. What should you do?
Show answer
Remove most of them. Indicators mostly repeat the same price information. Keep volume and RSI, or fewer.
What does the replay feature let you practise?
Show answer
Marking levels and making decisions without seeing what happened next, then playing the chart forward to see how price actually behaved.
Frequently asked questions
Do I need a paid TradingView plan to follow this Academy?
No. The free plan covers everything in these lessons. Paid plans add more indicators per chart, more alerts and extra replay options, which are nice to have but not necessary.
Can I trade directly from TradingView?
Some exchanges can be connected to the trading panel at the bottom of the screen. Beginners are usually better off placing orders on the exchange itself, where they can see margin mode, leverage and fees clearly.
Why does my chart look slightly different from someone else’s?
Different exchanges, spot versus futures, a different time zone or a different chart type can all change the wicks and candle times a little. Check the symbol name and the time zone first.
Is TradingView data accurate for crypto?
For the major exchanges it shows the exchange’s own price feed. Small differences between exchanges are normal, which is why you should chart the market you actually trade.
Crypto AI Signals sends liquidity shorts, RSI and AI plans to a private Telegram channel, each with an entry and a stop; you place and manage the trade yourself. Try it for 7 days or read the FAQ.
Risk notice. This lesson is education, not financial advice. Crypto futures are leveraged and you can lose some or all of the capital you trade with. A stop-loss limits a loss to the level you set; slippage and fast markets can make it larger. Past examples do not predict future results. Every trade you place is your own decision.