
How to read a crypto signal: zones, entries, stops and what’s left to you
A line-by-line guide to reading a crypto trading signal: pair, side, zones, entry, reference stop, why there’s no take-profit, and checks before you act.
A crypto signal is a trade plan written down by someone else. Reading one well means understanding every line of it well enough to decide, on your own, whether to take it, how large to make it and how you’ll get out. Copying the numbers without that understanding is how traders end up with positions they can’t explain.
This lesson walks through a real-format liquidity short from our Telegram channel, line by line, then covers what each possible outcome looks like, how to turn the plan into orders and a position size, and the checks to run before acting. It ties together what you learned in lesson 08 on liquidity zones and the position sizing lesson.
The parts of a signal
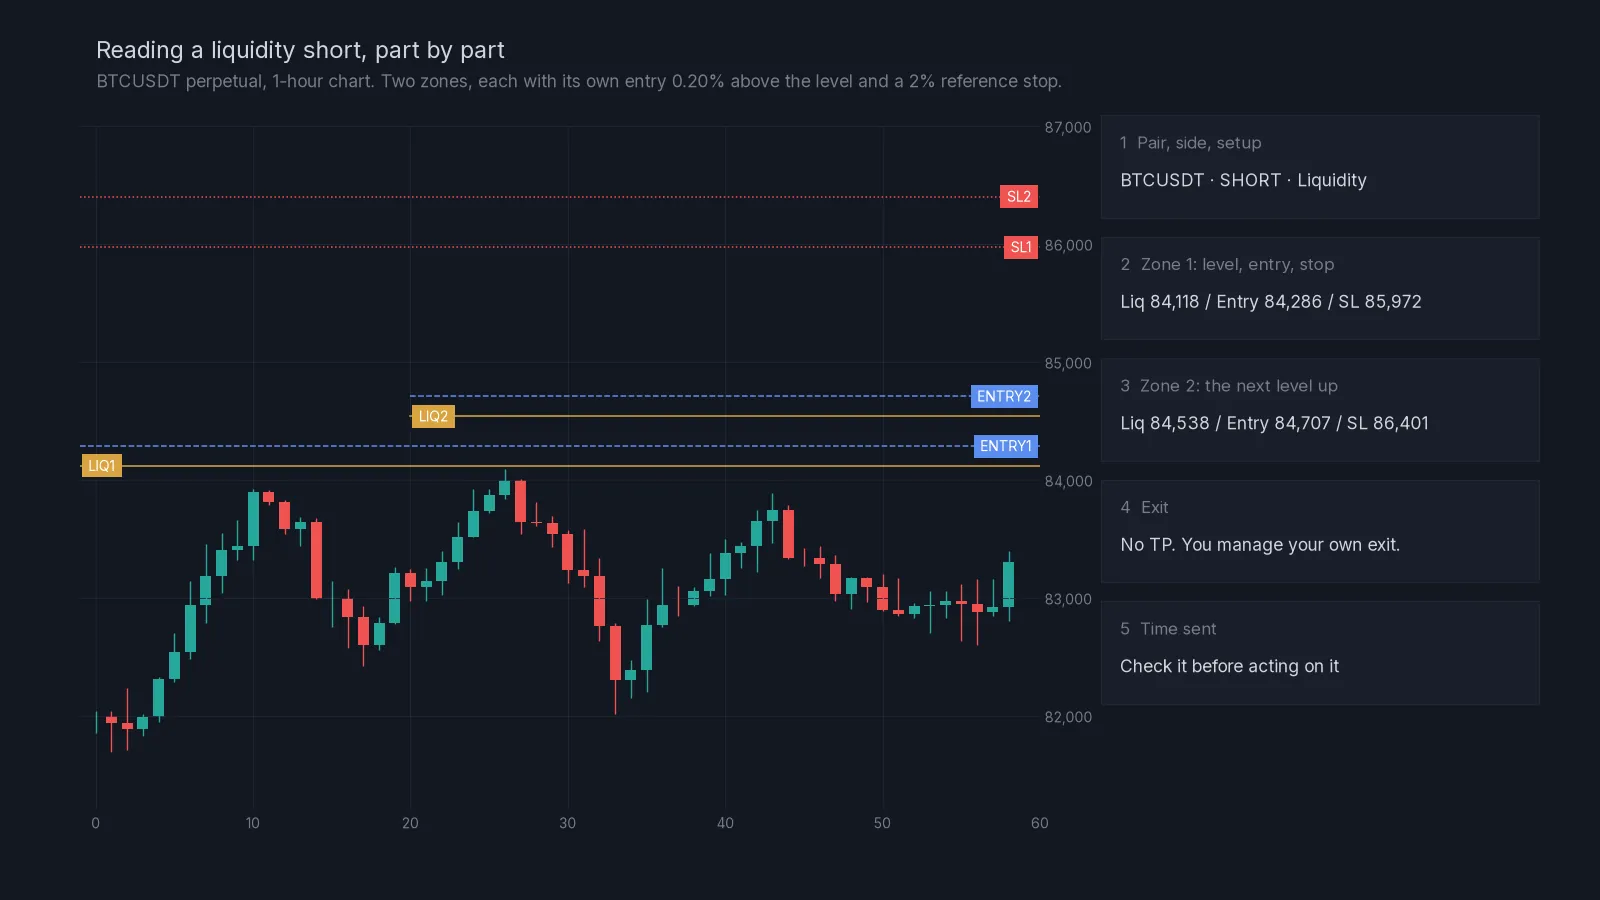
Here is a liquidity short in the format our channel uses. The chart arrives with it, already marked.
`` BTCUSDT · SHORT · Liquidity Zone 1 · Liq 84,118 / Entry 84,286 / SL 85,972 Zone 2 · Liq 84,538 / Entry 84,707 / SL 86,401 No TP. Manage your own exit. 21 Oct 2026, 17:45 ``
Read it from top to bottom.
1. Pair, side and setup
BTCUSDT is the market: Bitcoin against USDT, on Binance USDT-M perpetual futures. SHORT means the plan profits if price falls. Liquidity names the setup type, so you know which logic produced it and which lesson explains it. Our other two types are RSI plans and AI-assisted plans, which can be long or short.
2. The level
Liq 84,118 is the liquidity level on the 1-hour chart: a price where resting orders are likely to sit, usually above equal highs or a repeatedly tested swing high. The level itself is not the entry. It’s the reason the plan exists.
3. The entry
Entry 84,286 is 0.20% above the level: 84,118 × 1.002 = 84,286. The idea is to sell into the sweep, the quick push through the level that triggers stops, instead of shorting before the sweep happens. If you need a refresher on why sweeps happen, see liquidity sweeps and stop hunts.
4. The reference stop
SL 85,972 is 2% above the entry: 84,286 × 1.02 = 85,972. If price gets there, the liquidity idea for zone 1 is wrong and the trade is closed with a known loss. It’s called a reference stop because it’s the distance the plan was built around and the distance you size from. You can give it a little more room, but never less risk discipline: if you widen the stop, reduce the size to keep the same dollar risk.
5. The second zone
Zone 2 repeats the pattern one level higher: level 84,538, entry 84,707, stop 86,401. It only becomes relevant if price runs through zone 1. Each zone is its own trade with its own entry and its own stop. They are not “add to a losing position” instructions.
6. No take-profit
No TP is deliberate. Exits depend on your account, your timeframe and your temperament, so the plan doesn’t pretend there’s one correct target. You might close in two or three parts, trail the stop above new lower highs, or close everything at the next support. What matters is that you decide before the entry fills. The glossary entry on take-profit has the short definition.
7. The time
The timestamp tells you how fresh the plan is. A liquidity plan sent hours ago may already have played out. Before acting, check where price is relative to the zones now.
Three ways the plan can play out
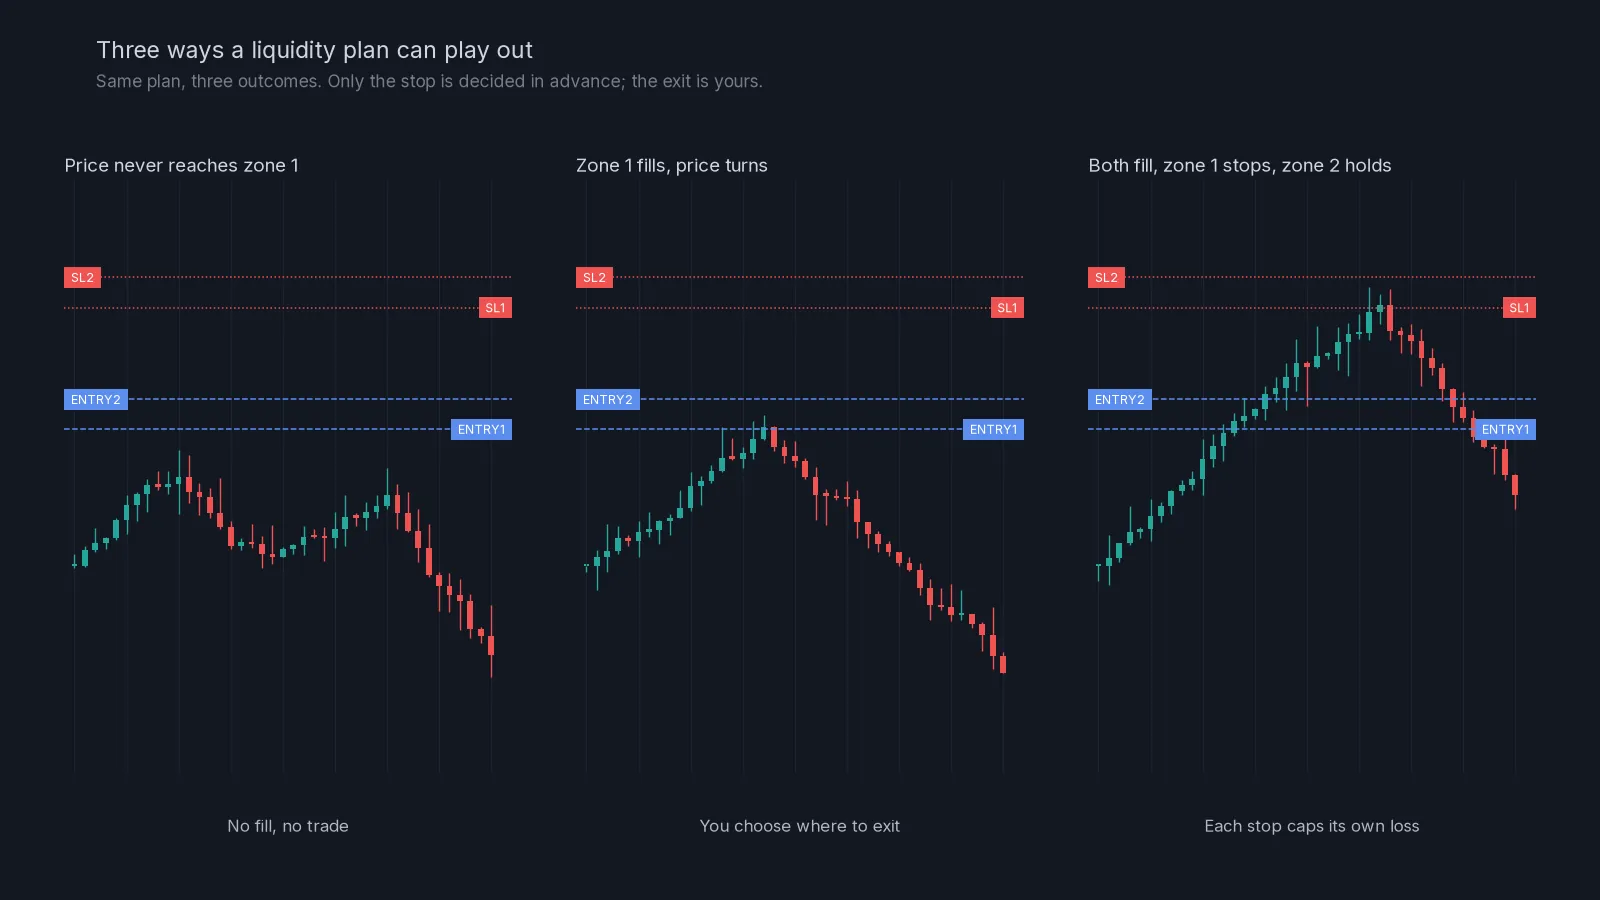
Price never reaches zone 1. Your limit order never fills. There’s no trade and no loss. This happens often, and it’s fine. Cancel the order when the setup no longer makes sense, for example after price has moved far away or the structure has changed.
Zone 1 fills and price turns. You’re in a short at 84,286 and price falls. This is where your exit plan matters. One common approach is to take part off at the nearest support, move the stop on the rest to around entry once price has moved well in your favour, and let the remainder run.
Both zones fill, zone 1 stops out, zone 2 holds. The levels sit close together, so on a strong push price fills entry 1 at 84,286, then entry 2 at 84,707, and only later reaches SL1 at 85,972. Zone 1 closes with its planned loss. Zone 2 is still open with its own stop at 86,401, and if price turns before that, it becomes the trade that works. Each stop caps its own loss, but both shorts were open at the same time.
That last point is the one people miss. If you’d lose $30 on each zone and both stop out, that’s $60. Decide in advance whether you’ll take one zone or two, and size each accordingly.
Turning the plan into orders
Here’s the full process for a trader with a $3,000 account who risks 1% ($30) per plan and decides to take both zones, splitting the risk evenly.
- Risk per zone: $30 ÷ 2 = $15.
- Zone 1 stop distance: 85,972 − 84,286 = 1,686 per BTC.
- Zone 1 size: $15 ÷ 1,686 = about 0.0089 BTC, worth roughly $750.
- Zone 2 stop distance: 86,401 − 84,707 = 1,694 per BTC.
- Zone 2 size: $15 ÷ 1,694 = about 0.0089 BTC, also around $750.
- Orders: a sell limit at each entry, with a stop-market order at each stop placed at the same time.
- Leverage: low enough that the liquidation price sits well above both stops. At 3x, $1,500 of total position needs about $500 of margin.
Run those numbers through the position size calculator once and you’ll see how little leverage has to do with risk. Leverage only changes the margin; the stop distance and size decide the loss.
Reading RSI and AI-assisted plans
The same reading habits apply to our other two types, with two differences.
RSI plans can be long or short and are only sent when the market is calm and range-like. When you read one, check that the market still looks like a range on the 4-hour chart. If a strong move has started since the plan was sent, the reason behind it may be gone. The lessons on RSI divergence and when RSI signals fail explain why.
AI-assisted plans can also be long or short. They come from our algorithm reading structure, momentum and technical data, and they arrive with an annotated chart, a marked entry and a reference stop. Read the chart, not just the numbers: where is the entry relative to the nearest level, and does the stop sit somewhere that makes sense on the chart? Our explainer on crypto AI signals covers what is automated and what stays your decision.
Checks before you act
Before placing any signal:
- Where is price now relative to the entry? If it’s already well past it, skip.
- Does the chart still match the reason for the plan (the level, the range, the structure)?
- Is there a major news event in the next hour?
- How many zones will you take, and how is your risk split between them?
- What’s the size for each zone, from the stop distance?
- Is your liquidation price well beyond the stop?
- How will you exit if it works? Write it down.
Common mistakes
Entering at market because the entry “probably fills”. The entry is part of the plan. A different entry is a different trade with a different risk.
Skipping the stop. A signal without a stop is a guess. A signal whose stop you ignore is a guess with extra steps.
Treating zone 2 as averaging down. It’s a separate trade with its own stop, and it needs its own share of the risk budget.
Sizing by feel. Every zone gets a size calculated from its stop distance and your risk, every time.
Taking every signal. You’re allowed to skip. Many good traders take a fraction of the plans they receive and write down why they skipped the rest, which is the subject of the next lessons.
What’s next
Read crypto AI signals explained for the bigger picture, then keeping a trading journal to record how the plans you take actually perform for you. If you’d like to see the format in a live market, the 7-day trial gives full access.
Check yourself
Answer in your head first, then open the answer.
A level is 2,400. Where is the entry on one of our liquidity shorts?
Show answer
0.20% above the level: 2,400 × 1.002 = 2,404.80.
The entry is 2,404.80. Where is the reference stop?
Show answer
2% above the entry: 2,404.80 × 1.02 = about 2,452.90.
You risk $20 on one zone with a stop distance of $48 per coin. How many coins is the position?
Show answer
$20 ÷ 48 = about 0.42 coins.
Why don’t our signals include a take-profit?
Show answer
Because exits depend on each trader’s account, timeframe and plan. The signal fixes the entry and the stop; the exit is your decision, made before the entry fills.
Frequently asked questions
What should a good crypto signal include?
At least the pair, the side, the entry and the stop. A chart showing why the level matters, and a timestamp, make it much easier to judge.
Should I use a limit order or a market order for the entry?
For liquidity shorts, a limit order at the entry. The entry is planned for the sweep, and entering at market changes both the price and the risk.
Can I use a wider stop than the reference stop?
Yes, if you reduce the position size so that the dollar risk stays the same. Never widen the stop and keep the size.
What if price has already passed the entry when I see the signal?
Skip it, or wait for price to return to the entry. Chasing a plan means trading a different setup than the one that was sent.
Do I have to take both zones?
No. Many traders take only zone 1, or only take zone 2 after a clear sweep. Whatever you choose, decide before the first order fills and split your risk to match.
Crypto AI Signals sends liquidity shorts, RSI and AI plans to a private Telegram channel, each with an entry and a stop; you place and manage the trade yourself. Try it for 7 days or read the FAQ.
Risk notice. This lesson is education, not financial advice. Crypto futures are leveraged and you can lose some or all of the capital you trade with. A stop-loss limits a loss to the level you set; slippage and fast markets can make it larger. Past examples do not predict future results. Every trade you place is your own decision.