
RSI divergence: what it shows, how to spot it and when to ignore it
Learn what RSI divergence is, how to mark bullish, bearish and hidden divergence correctly, and why it only matters at a level you marked in advance.
RSI divergence is what happens when price and momentum stop agreeing. Price makes a new high, but RSI makes a lower one. Or price makes a new low while RSI holds above its last low. It’s one of the most shared chart patterns in crypto, and one of the most overrated when it’s used on its own.
This lesson shows you what divergence actually measures, how to draw it without fooling yourself, the four types you’ll hear about, and the one rule that makes it useful: divergence is a reason to pay attention at a level, never a reason to trade by itself. You should be comfortable with RSI explained and support and resistance before reading on.
What divergence actually measures
RSI compares the size of recent up moves with the size of recent down moves. When price pushes to a new high with smaller, slower candles than the push before it, RSI rises less. Price is higher, but the effort behind the move is weaker. That gap between result and effort is divergence.
Think of a runner going up two hills. On the first hill they sprint. On the second, which is slightly higher, they walk. They still reached a higher point, but you would not bet on a third, even higher hill at the same pace. That’s all divergence says: the move is getting tired.
What it does not say is just as important. A tired move can keep going for a long time, especially in crypto, where one large order or a funding squeeze can restart momentum in minutes. Divergence describes the past few swings. It is not a forecast.
Bearish divergence
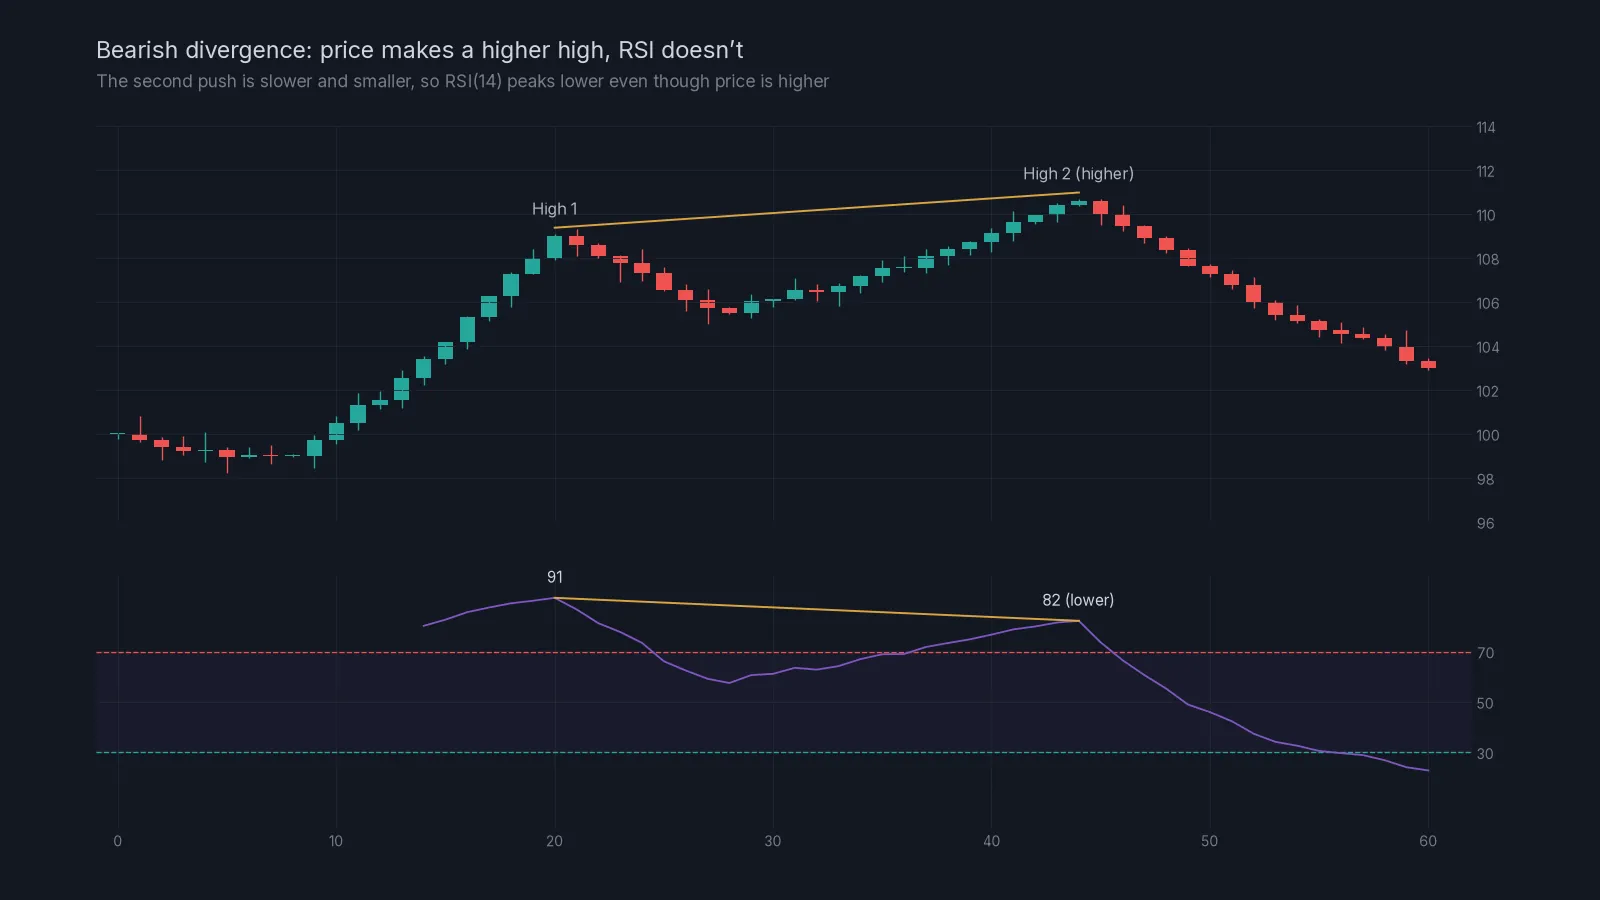
Bearish divergence forms at the top of a move:
- Price: the second swing high is higher than the first.
- RSI: the RSI value at the second high is lower than at the first.
In the chart above, the first push is fast and RSI reaches about 91. The second push is slow and drifts to a higher high, and RSI only reaches about 82. Buyers still won, but by less each time.
Bullish divergence
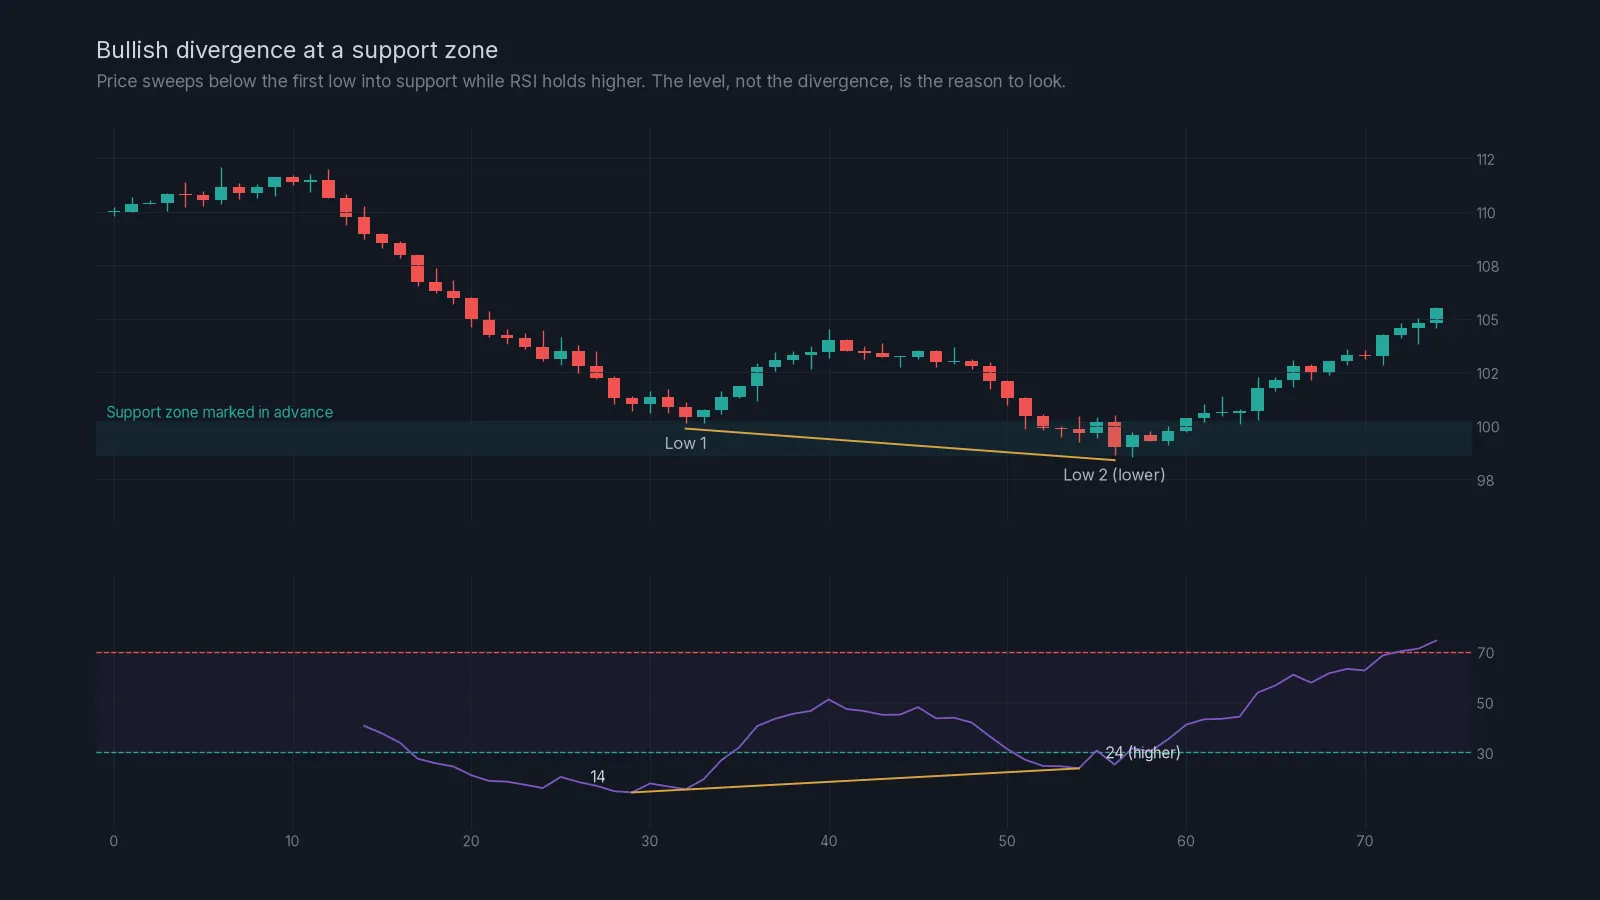
Bullish divergence is the mirror image, at the bottom of a move:
- Price: the second swing low is lower than the first.
- RSI: the RSI value at the second low is higher than at the first.
Look at where it happens in the chart: inside a support zone that was marked before price arrived, and on a small sweep below the first low. That combination is far more interesting than the same divergence in the middle of nowhere. If you’ve read the lesson on liquidity sweeps and stop hunts, you’ll recognise the shape: stops below the first low get taken, selling dries up, and RSI shows the drop had less force behind it.
Hidden divergence
You’ll also see “hidden divergence” mentioned. It points the other way. Instead of hinting at a turn, it hints that a trend is continuing:
| Type | Price | RSI | What it suggests |
|---|---|---|---|
| Regular bearish | Higher high | Lower high | Upward momentum fading |
| Regular bullish | Lower low | Higher low | Downward momentum fading |
| Hidden bullish | Higher low | Lower low | Pullback in an uptrend losing force |
| Hidden bearish | Lower high | Higher high | Bounce in a downtrend losing force |
Hidden divergence is easy to over-find, because almost every pullback in a trend produces some version of it. If you use it at all, use it the way you would use a normal pullback entry: in a trend you’ve already confirmed with market structure, at a level, with a stop beyond the swing.
How to draw divergence without fooling yourself
Most bad divergence calls come from sloppy drawing. Five rules keep it honest:
- Use clear swing points. A swing high has lower highs on both sides of it. Don’t connect a swing high to a random candle that happens to look convenient.
- Compare like with like. For bearish divergence, compare highs in price with the RSI values at those same candles. For bullish divergence, compare lows with lows.
- Same timeframe. Price swings on the 1-hour chart must be compared with RSI on the 1-hour chart, not the 4-hour.
- Wait for the swing to finish. A second high isn’t a swing high until price has moved away from it. Divergence on a candle that’s still open can disappear when it closes.
- Ignore tiny gaps. RSI at 71 versus 70 isn’t divergence. Look for a clear difference, several points or more.
A worked example
ETHUSDT has been in an uptrend on the 4-hour chart. You’ve marked a resistance zone from 3,540 to 3,570 where price turned twice last month.
- On the 1-hour chart, price pushes to 3,512 with RSI at 78.
- It pulls back to 3,440, then grinds up slowly into your zone, printing a high of 3,566. RSI reaches only 66.
- The next candle closes at 3,531, back below the top of the zone, with a long upper wick.
That’s a higher high in price, a lower high in RSI, inside a level you marked in advance, with a rejection candle. Now you have something worth planning.
A short plan might use an entry near 3,530 and a stop above the zone and the wick, at about 3,600. That’s 70 dollars away, roughly 2%. With a $4,000 account risking 1% ($40), the position size is $40 ÷ 70 = about 0.57 ETH, worth around $2,010. You can check those numbers in the position size calculator. Notice that the stop doesn’t care about RSI at all. It goes where the idea is clearly wrong: above the level.
Now imagine the same divergence at 3,470, in the middle of an open chart, with no level near it. Same RSI readings, far weaker idea. There’s no logical place for the stop and no reason for sellers to show up there.
When to ignore divergence
Divergence is least reliable in exactly the conditions where beginners notice it most:
- Strong trends. In a powerful rally, RSI can print three or four lower highs while price keeps climbing. Each one looks like a top. The lesson on when RSI signals fail shows this in detail.
- Low timeframes. On the 1-minute and 5-minute charts, divergence appears constantly. Most of it is noise.
- News and big events. A listing, an exchange problem or a macro data release can override any momentum pattern.
- No level. If you can’t say which level the divergence is happening at, it isn’t a setup.
This is also why our own RSI long and short signals only run when the market is calm and range-like, and are switched off in strong trends, crashes and sharp pumps. In those conditions momentum indicators stop describing turns.
A divergence checklist:
- Mark your levels first on the 4-hour and 1-hour charts.
- Confirm the market state: range, uptrend or downtrend.
- When price reaches a level, look for two clear swing points in price.
- Compare RSI at those exact candles, on the same timeframe.
- Wait for the second swing to complete and for a rejection candle.
- Put the stop beyond the level, not where RSI might change.
- Size the position from that stop and risk the same small share of your account as always.
Common mistakes
Trading divergence as a signal on its own. It’s a description of momentum. Without a level and a stop, it’s just a drawing.
Drawing lines between whatever points fit. If you have to squint, it isn’t there.
Fighting a trend because of divergence. Shorting every bearish divergence in a strong uptrend is the RSI version of shorting every reading above 70.
Acting before the swing completes. Wait for the candle to close and price to move away.
Forgetting the higher timeframe. Bullish divergence on the 15-minute chart means little if the 4-hour chart is breaking down through support.
What’s next
The next lesson, when RSI signals fail, covers the market conditions that break RSI readings, including divergence, and how to recognise them before they cost you. If any term here was new, the glossary has short definitions, and lesson 06 on candlestick patterns explains the rejection candles mentioned above.
Check yourself
Answer in your head first, then open the answer.
Price makes a higher high, and RSI at that candle is lower than at the previous high. What is this called?
Show answer
Regular bearish divergence. It shows upward momentum fading.
Price makes a higher low in an uptrend while RSI makes a lower low. What is this?
Show answer
Hidden bullish divergence, which hints that the pullback is losing force and the trend may continue.
You spot bearish divergence in the middle of a range with no level nearby. Is it a setup?
Show answer
Not really. Without a level there is no reason for sellers to appear there and no logical place for the stop.
Why can divergence fail repeatedly in a strong trend?
Show answer
Because momentum can stay high, or recover quickly, while price keeps moving. Each new push can produce another divergence before price finally turns.
Frequently asked questions
Is RSI divergence reliable?
It’s useful as supporting evidence, not as a stand-alone signal. It works best at levels marked in advance and in calmer markets, and much less well in strong trends.
Which timeframe is best for RSI divergence?
The timeframe you plan your trades on. For most crypto traders that’s the 1-hour or 4-hour chart. Below 15 minutes it appears too often to mean much.
What is the difference between regular and hidden divergence?
Regular divergence hints that a move is running out of force and may turn. Hidden divergence hints that a pullback against the trend is running out of force and the trend may continue.
Should I use other indicators to confirm divergence?
You don’t need more indicators. Confirmation should come from price: a marked level, a rejection candle and market structure.
Can I find divergence with MACD instead of RSI?
Yes, the idea is the same with any momentum indicator. The rules about levels, swing points and stops don’t change.
Crypto AI Signals sends liquidity shorts, RSI and AI plans to a private Telegram channel, each with an entry and a stop; you place and manage the trade yourself. Try it for 7 days or read the FAQ.
Risk notice. This lesson is education, not financial advice. Crypto futures are leveraged and you can lose some or all of the capital you trade with. A stop-loss limits a loss to the level you set; slippage and fast markets can make it larger. Past examples do not predict future results. Every trade you place is your own decision.