
When RSI signals fail: trends, range breaks, news and thin markets
The market conditions that break RSI overbought, oversold and divergence signals in crypto, how to recognise each one early, and a simple filter to use first.
RSI is a good tool used in the wrong place more often than any other indicator in crypto. Most losing RSI trades don’t fail because the reading was wrong. RSI did exactly what it always does, measured recent momentum, in a market where momentum readings stop marking turns.
This lesson goes through the six situations where RSI signals fail most often, shows what each looks like on a chart, and ends with a short filter you can run before any RSI trade. It builds on RSI explained and RSI divergence. It’s also the honest background to a rule in our own process: RSI long and short plans are only sent in stable, range-like markets.
Why RSI fails at all
RSI only knows one thing: how large recent gains were compared with recent losses. It knows nothing about where price is, what the higher timeframe is doing, who is trapped, or what’s on the calendar. When those things dominate the market, RSI keeps producing readings, and the readings stop meaning what traders want them to mean.
So the question is never “is RSI working today?” It’s “is this the kind of market where RSI extremes usually mark turns?”
1. Strong trends
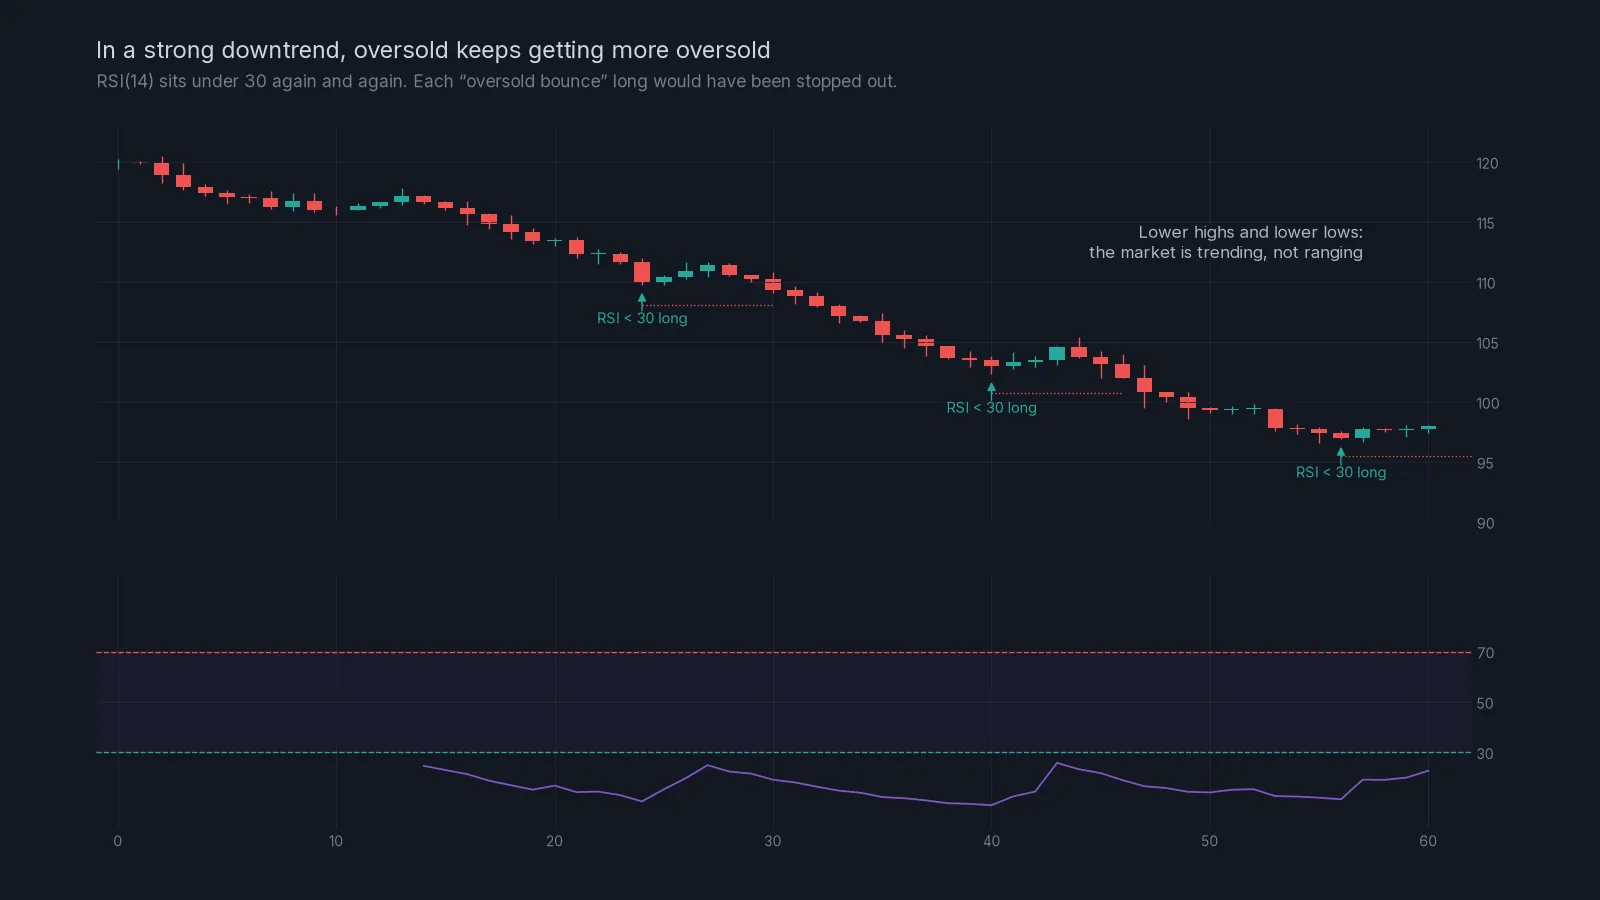
This is the classic failure. In a strong downtrend, sellers are in control and every candle is mostly down, so RSI sits under 30 for long stretches. Buying “because it’s oversold” means buying into a market that keeps making lower highs and lower lows. The same happens above 70 in a strong uptrend.
How to recognise it: on the 4-hour chart you see a clear sequence of lower highs and lower lows (or higher highs and higher lows). On the RSI panel, the line rarely crosses back above 50 in a downtrend, or below 50 in an uptrend. The lesson on market structure covers how to read the swings.
What to do: stop treating extremes as reversal signals. In a trend, an extreme reading is a sign of strength in the direction of the trend.
2. Range breaks
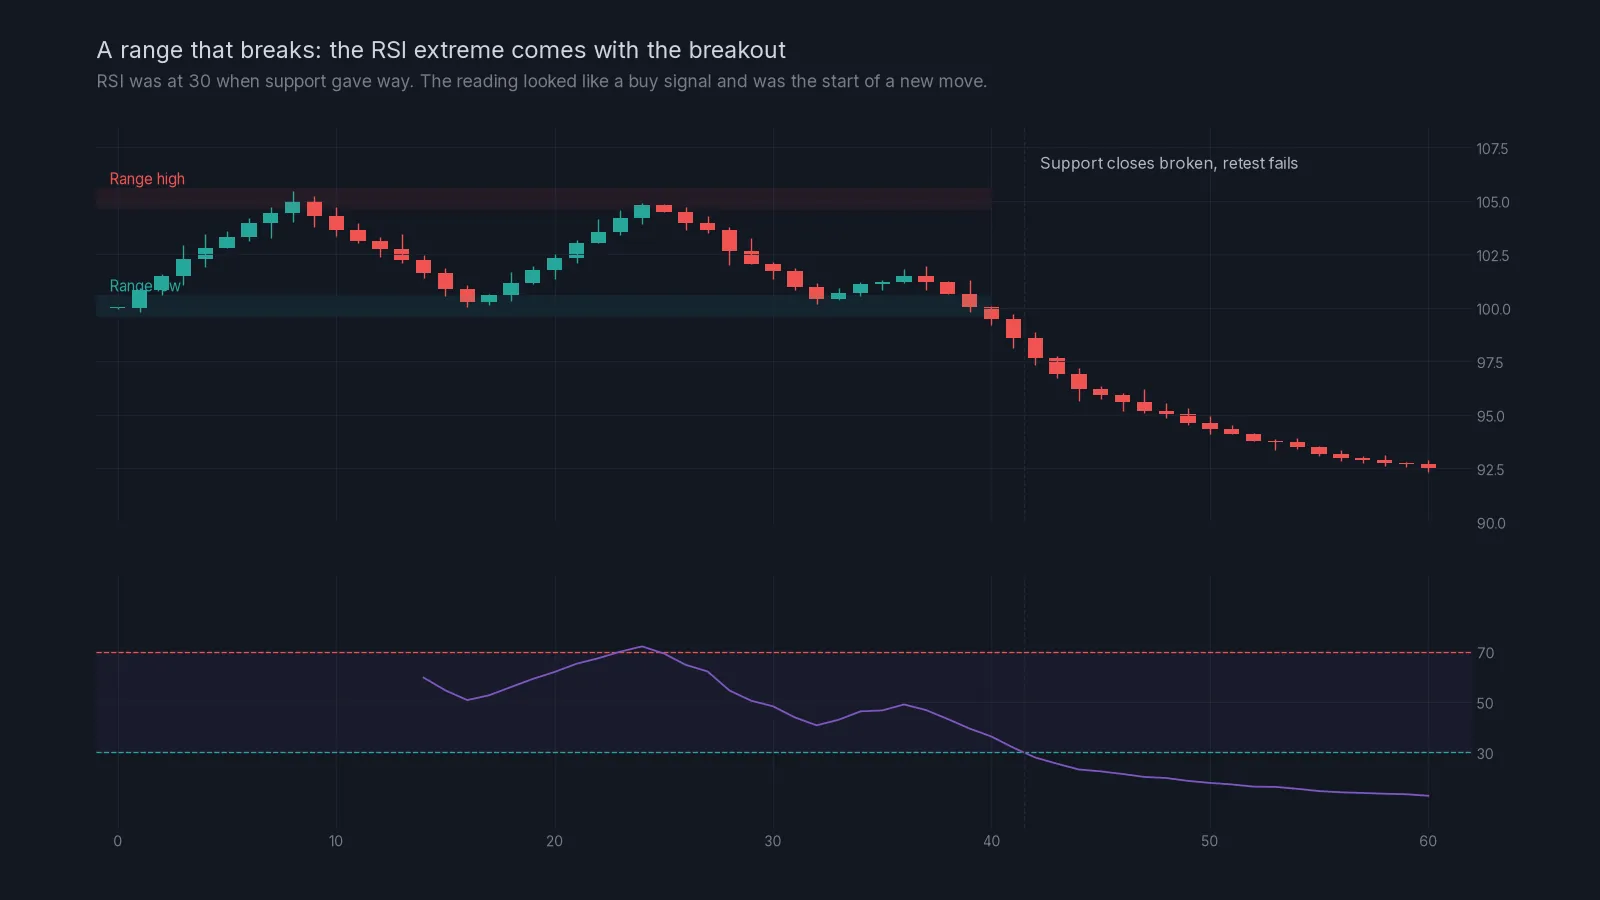
Ranges are where RSI works best, which is exactly why range breaks hurt. Price has bounced from the range low three times with RSI near 30, so the fourth time looks familiar. This time support breaks, the stops below it get triggered, and the oversold reading becomes the first step of a trend.
How to recognise it: the range has been tested many times (each test uses up some of the buying at that level), volume rises on the move into the level instead of fading, and candles close beyond the level rather than just wicking through it. A failed retest, price coming back up to the old support and getting rejected, confirms it.
What to do: put your stop beyond the level, not a fixed distance from your entry. If support closes broken, the range idea is wrong and you’re out with a small, planned loss.
3. News and scheduled events
A CPI release, a rate decision, a big exchange announcement or a token unlock can move price several percent in a minute. RSI will hit an extreme within a candle or two, and that extreme says nothing about where the move ends.
What to do: check the calendar before you trade. Many traders simply don’t open new RSI trades in the hour around major releases. It costs you very little and removes a whole category of random outcomes.
4. Liquidation cascades and squeezes
Crypto futures add a failure mode that most RSI guides don’t mention. When many leveraged traders sit on the same side, a move against them triggers liquidations, which are forced market orders, which push price further and trigger more liquidations. RSI goes to 10 or 90 and stays there while the cascade runs.
How to recognise it: long wicks across several levels at once, very high volume, and funding rates that were heavily one-sided before the move. After a cascade ends, RSI readings become useful again, but not during it.
5. Thin markets
Small-cap coins, new listings and weekends have less liquidity. A modest order can push RSI to an extreme without any real shift in supply and demand. The reading reflects one participant, not the market.
What to do: be more selective with RSI on illiquid pairs, use smaller size, and prefer major pairs such as BTCUSDT and ETHUSDT for momentum ideas.
6. The wrong timeframe
On the 1-minute and 5-minute charts, RSI touches 70 and 30 many times a day. Most of those touches are noise. Traders who read RSI on a low timeframe but expect a move the size of a 4-hour swing are asking the indicator for something it can’t give.
What to do: read RSI on the timeframe you plan on, usually the 1-hour or 4-hour chart, and use lower timeframes only to fine-tune an entry at a level you already chose. The TradingView lesson shows how to set up a multi-timeframe layout.
A worked example: the same reading, two outcomes
SOLUSDT has ranged between 168 and 182 on the 4-hour chart for two weeks. Price drops to 168.6, and the 1-hour RSI reads 27.
Version A. The 4-hour structure is flat, the drop came on fading volume, the candle wicks to 167.9 and closes back at 169.4, and there’s no event scheduled. A long plan could use an entry near 169.4 and a stop below the range low and the wick at 166.0, about 2% away. With a $3,000 account and 1% risk ($30), the position would be $30 ÷ 3.4, about 8.8 SOL, worth roughly $1,490.
Version B. Same RSI reading, but this is the fifth test of 168 in a week, volume is rising into the level, and the 1-hour candle closes at 166.8, below the range. There is no long here. The oversold reading is part of the breakdown, not a sign of its end.
The RSI number was identical. Everything around it decided the trade.
Why our RSI plans have a market filter
This is the reason our RSI long and short signals are only sent when conditions are stable and range-like. During strong trends, crashes, sharp pumps and obvious manipulation, the same RSI readings stop marking turns, so the plans are paused rather than forced. You can read how the three signal types differ on the home page, and how AI-assisted plans use a similar filter in crypto AI signals explained.
A five-question filter before any RSI trade:
- Market state: is the 4-hour chart ranging, or clearly trending? If trending, skip extreme-based reversals.
- Level: is price at a support or resistance zone you marked before it got there?
- Behaviour: did the candle reject the level, or close through it?
- Calendar: is there a major release or event in the next hour?
- Liquidity: is this a liquid pair, during normal hours?
Common mistakes
Blaming the indicator. RSI measured momentum correctly. The market wasn’t one where momentum extremes mean much.
Averaging down because RSI is “even more oversold”. In a trend that’s how a small loss becomes a large one.
Moving the stop because RSI should turn soon. The stop belongs beyond the level. RSI has no say in where you’re wrong.
Trading RSI during the event itself. Wait until the move has settled and the chart has formed new levels.
What’s next
The RSI module ends here. Continue with risk management in the position sizing lesson, then see how a full plan is laid out in how to read a crypto signal. Definitions for range, trend and liquidation are in the glossary.
Check yourself
Answer in your head first, then open the answer.
RSI on the 4-hour chart has stayed below 40 for three days while price makes lower lows. Is a reading of 25 a good reason to buy?
Show answer
No. The market is trending down, so oversold readings describe strength in the trend rather than a turn.
Price has tested a range low five times and volume is rising into it. What risk does that create for an RSI long?
Show answer
A range break. Repeated tests use up buying at the level, and rising volume into it suggests sellers are pressing.
Where should the stop go on an RSI long at range support?
Show answer
Beyond the range low and any sweep wick, where the range idea is clearly wrong, not where RSI might turn.
Why do RSI readings during a liquidation cascade mean little?
Show answer
Because forced market orders keep pushing price regardless of momentum, so RSI can stay at an extreme until the cascade ends.
Frequently asked questions
Does RSI work in crypto?
It works in crypto as well as anywhere, in the right conditions: liquid pairs, range-bound markets and a sensible timeframe. It works poorly in strong trends, around news and in thin markets.
Why does RSI stay overbought for so long?
Because in a strong uptrend most candles close higher, so recent gains keep outweighing recent losses. That’s a sign of strength, not of an imminent drop.
How do I know if the market is trending or ranging?
Look at swing highs and lows on the 4-hour chart. Higher highs and higher lows mean an uptrend, lower highs and lower lows a downtrend, and repeated turns between two zones a range.
Should I stop using RSI altogether?
No. Use it where it helps, as confirmation at levels in ranges, and stop using extremes as reversal signals in trends.
Do your RSI signals run every day?
No. RSI plans are sent only in stable markets and are paused during strong trends, crashes, sharp pumps and obvious manipulation.
Crypto AI Signals sends liquidity shorts, RSI and AI plans to a private Telegram channel, each with an entry and a stop; you place and manage the trade yourself. Try it for 7 days or read the FAQ.
Risk notice. This lesson is education, not financial advice. Crypto futures are leveraged and you can lose some or all of the capital you trade with. A stop-loss limits a loss to the level you set; slippage and fast markets can make it larger. Past examples do not predict future results. Every trade you place is your own decision.