
Keeping a trading journal: what to record and how to review it
How to keep a crypto trading journal that improves your trading: what to record, how to measure results in R, a weekly review routine and common mistakes.
A trading journal is a record of every trade you take: what you planned, what you did, and what happened. It sounds like admin. It’s actually the only reliable way to find out whether your losses come from the market, from your setups or from you.
Most traders skip it because the market feels more interesting than a spreadsheet. Then, after a few months, they can’t say which setups work for them, how much a typical loss costs, or whether that bad week was bad luck or bad habits. This lesson shows you what to record, how to measure results in a way that makes trades comparable, and a weekly review that takes twenty minutes. It’s the last lesson in the learning path, and it ties together everything from trading from zero onwards.
Why a journal works
Memory is a poor record keeper. You remember the trade that went 5R in your favour and forget the four small losses you took chasing entries the same week. You remember being “unlucky” with a stop and forget that you moved it twice.
A journal fixes that by turning trades into data you can read back calmly. After 30 or 40 entries, patterns appear that are impossible to see trade by trade: a setup that keeps losing, a time of day where you trade badly, a habit of entering late. None of this requires software. A spreadsheet and the discipline to fill it in are enough.
What to record
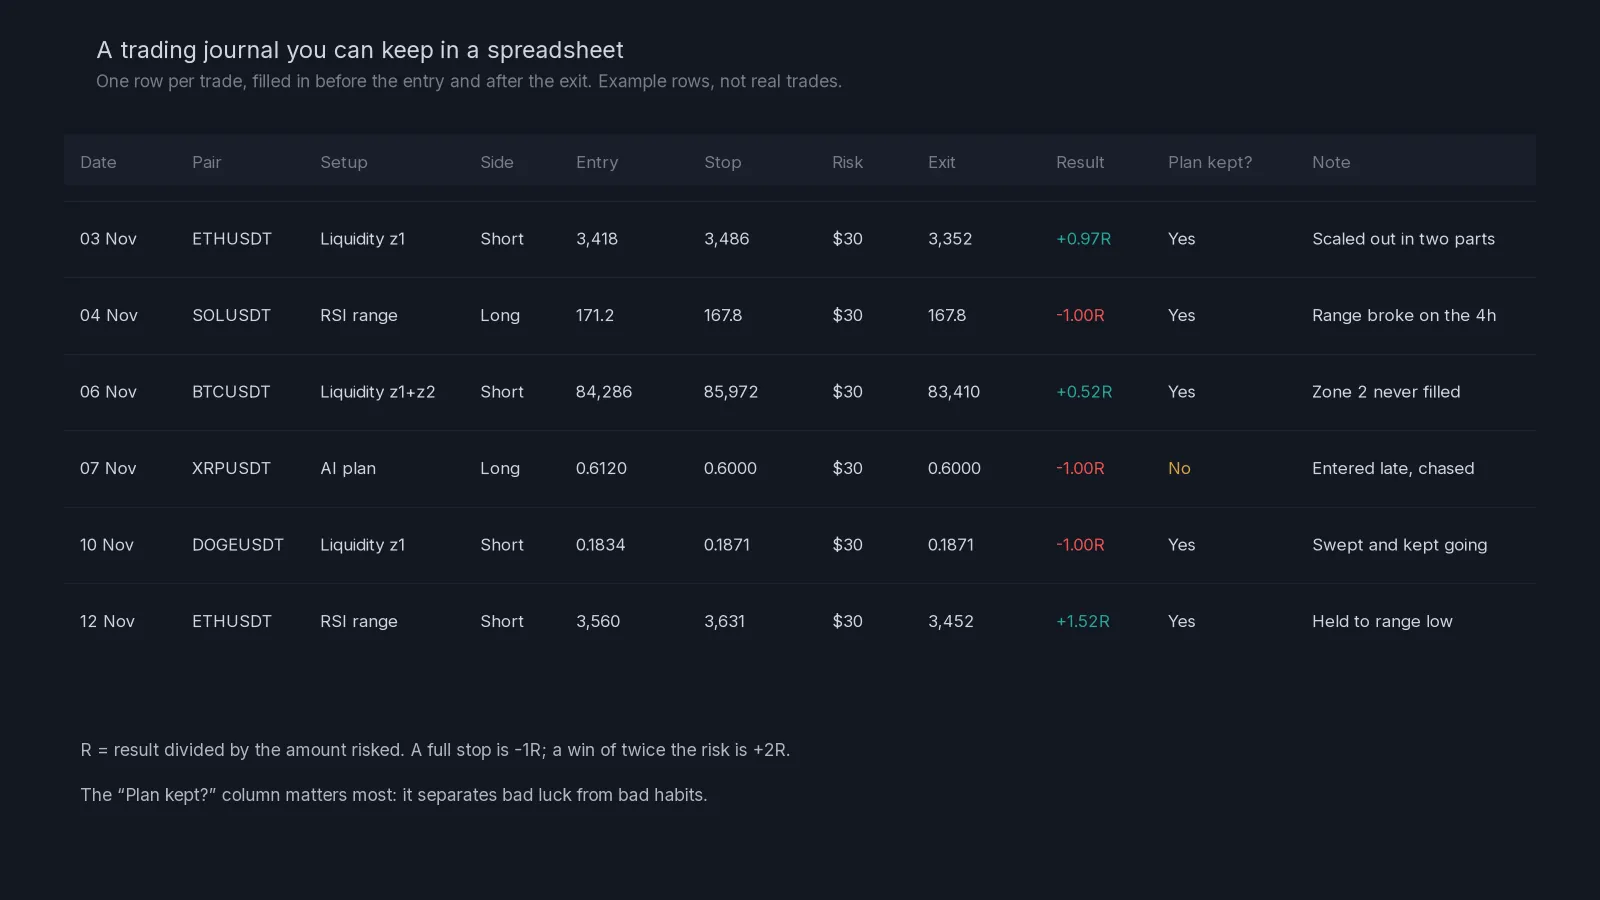
Keep it short enough that you’ll actually fill it in. These columns cover almost everything that matters:
| Column | What to write | When |
|---|---|---|
| Date and time | When the entry filled | Before |
| Pair | For example ETHUSDT | Before |
| Setup | Liquidity zone 1, RSI range, AI plan, your own idea | Before |
| Side | Long or short | Before |
| Entry and stop | The planned prices | Before |
| Risk | The dollars you lose if the stop is hit | Before |
| Exit plan | How you intend to get out | Before |
| Exit | The actual exit price or prices | After |
| Result in R | Result divided by risk | After |
| Plan kept? | Yes or no, honestly | After |
| Note | One line on what happened and why | After |
Two optional columns are worth adding once the basics are a habit: a screenshot link for the chart at entry, and a one-word note on how you felt (calm, rushed, frustrated). The feeling column sounds soft, but it’s often where the expensive patterns hide.
Before and after
Fill in the first half before the entry fills, while the plan is still a plan. If you write the reasons after the trade, you’ll write reasons that fit the result. Then fill in the second half after the exit, the same day if you can.
Measuring results in R
Dollars make trades hard to compare. A $40 loss on a $4,000 account and a $40 loss on a $1,000 account aren’t the same thing, and neither is a $40 loss on a trade where you risked $20 by accident. Measuring in R fixes this.
R is the amount you risked on the trade. If you risk $30 and lose $30, the result is −1R. If you risk $30 and make $45, the result is +1.5R.
A worked example from a liquidity short, using the format explained in how to read a crypto signal:
- Entry 3,418, reference stop 3,486. Stop distance: 68 per ETH.
- Risk: $30, so the size is $30 ÷ 68 = about 0.44 ETH.
- You exit half at 3,370 and half at 3,334. The average exit is 3,352.
- Result per ETH: 3,418 − 3,352 = 66. Times 0.44 ETH = about $29.
- In R: $29 ÷ $30 = +0.97R (before fees).
Once every trade is in R, you can add them up, compare setups and see what a typical win and a typical loss look like for you. If you want to double-check the size, the position size calculator does the first part of the math.
Why R keeps you honest
R exposes sizing mistakes immediately. If a “normal” loss shows up as −2.4R, you either moved the stop or sized the trade wrong. Both are worth knowing about. A full stop-out should always be close to −1R, plus fees and any slippage. If it isn’t, the journal has found a problem with your process, not with the market.
The weekly review
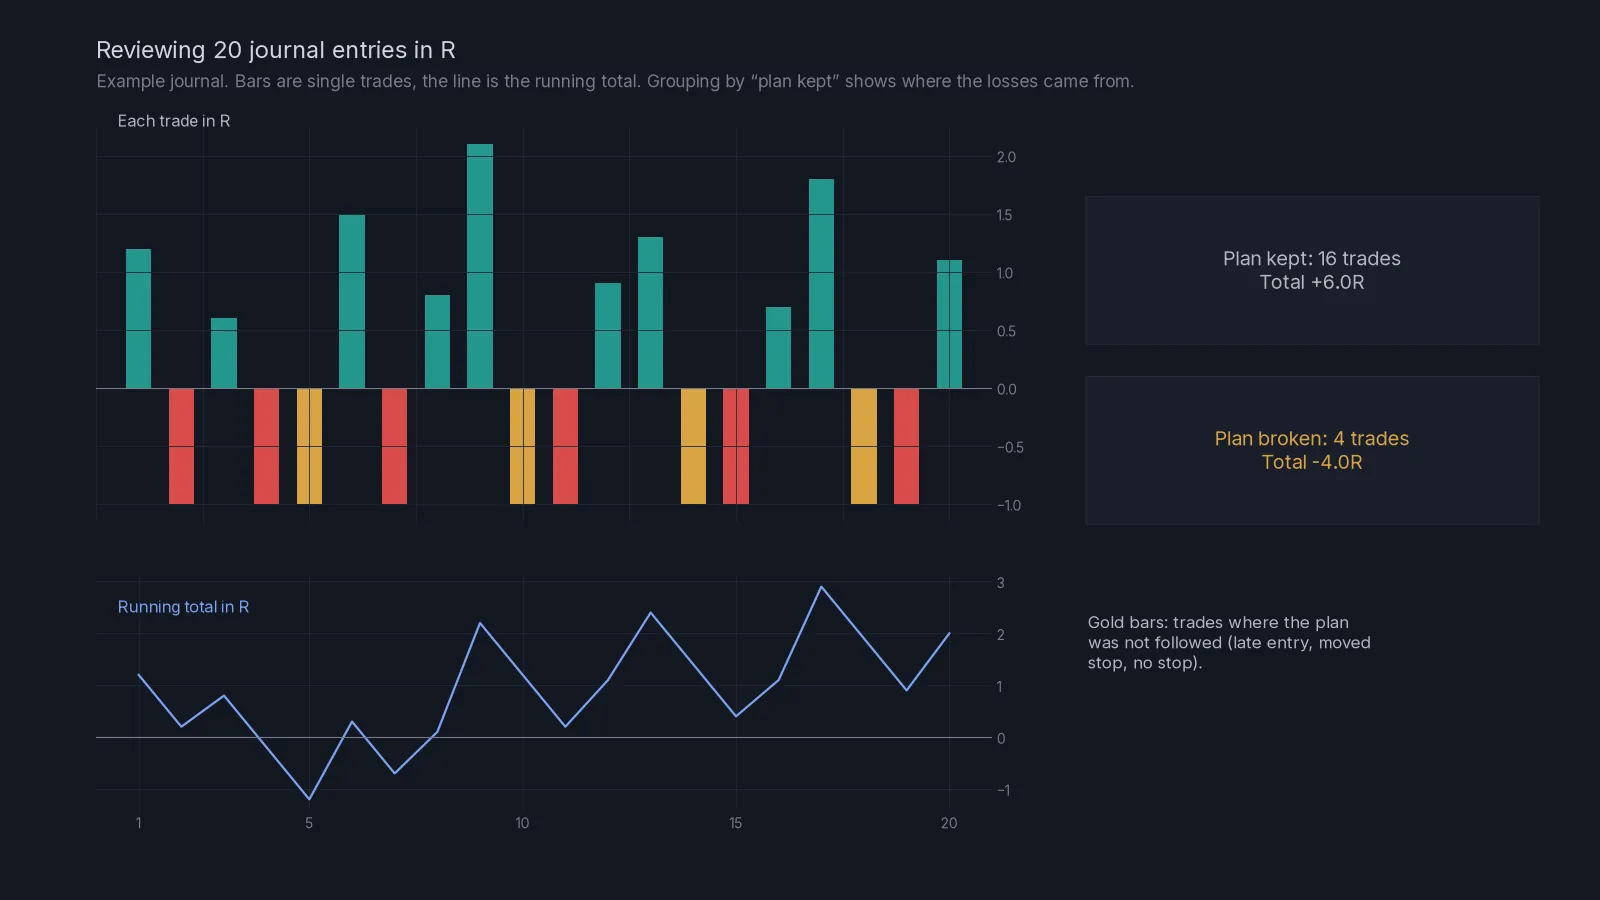
Once a week, sit down with the journal for twenty minutes. Don’t look at it during the trading day; that turns it into a scoreboard.
A twenty-minute weekly review:
- Check that every trade from the week is in the journal, including the bad ones.
- Add up the week in R, then split it into “plan kept” and “plan broken”.
- Group results by setup type: liquidity zones, RSI plans, AI plans, your own ideas.
- Read the notes on the three worst trades. Was each one a valid plan that lost, or a broken rule?
- Look for one repeated mistake: late entries, moved stops, trading during news, oversizing after a loss.
- Write one rule change for next week, and only one.
- Note how many signals or setups you skipped and why. Good skips are part of a good week.
In the example chart, the sixteen trades where the plan was kept add up to a positive total, and the four where it wasn’t account for a large share of the losses. The numbers are illustrative, but the shape is common: a handful of broken-rule trades often explain most of a bad month.
Journaling signals you receive
If you trade signals, including ours, journal them the same way as your own ideas, with two extra notes.
Write down which zones you took and why. On a liquidity plan with two zones, record whether you took zone 1, zone 2 or both, and how you split the risk.
Record the signals you skip, briefly. One line is enough: “Skipped, price already past entry” or “Skipped, CPI in 30 minutes”. Over time you’ll learn whether your filter helps. Some traders find their skipped list was the most valuable part of the journal.
Because our plans carry an entry and a reference stop but no take-profit, your exits are entirely yours. The journal is where you find out which exit style suits you: closing at the first support, scaling out in parts, or trailing the stop. Compare them in R after twenty or thirty trades each.
Common mistakes
Only logging winners. A journal with gaps is worse than no journal, because it tells you a flattering story.
Writing the reason after the result. Fill in the plan before the entry fills.
Measuring in dollars only. You can’t compare trades of different sizes. Use R.
Changing five things after one bad week. One change at a time, then give it a few weeks.
Reviewing during the trading day. It turns the journal into a mood meter. Keep the review for the weekend or a quiet evening.
Expecting the journal to predict the future. It describes your past trades. It can show you what to stop doing, which is usually worth more than any new setup.
Where to go from here
You’ve reached the end of the learning path. If you skipped any lessons, the Academy hub lists them in order. Keep the glossary bookmarked, revisit position sizing whenever your account size changes, and reread when RSI signals fail the next time a market feels “obviously” overbought. If you’d like structured plans to journal against, the 7-day trial is the simplest way to start.
Check yourself
Answer in your head first, then open the answer.
You risk $25 on a trade and make $50. What is the result in R?
Show answer
+2R, because $50 ÷ $25 = 2.
A full stop-out shows up in your journal as −2.1R. What does that suggest?
Show answer
The stop was moved or the position was oversized. A normal stop-out should be close to −1R plus fees.
Why fill in the plan columns before the entry fills?
Show answer
So the reasons reflect your plan, not the outcome. Written afterwards, reasons tend to fit the result.
After a bad week, how many rules should you change?
Show answer
One. Change one thing at a time so you can tell what made the difference.
Frequently asked questions
What is the best trading journal for crypto?
A simple spreadsheet is enough for most traders. The format matters far less than filling it in for every trade.
How many trades do I need before the journal is useful?
Patterns start to appear after 30 to 40 trades, and become clearer after 100. Even the first ten will show you sizing mistakes.
Should I include fees in my results?
Yes. Futures fees on both entry and exit add up, especially on smaller wins. Record the result after fees, or add a fee column.
What does R mean in trading?
R is the amount you risked on a trade. Results in R, such as +1.5R or −1R, make trades of different sizes comparable.
Do I need to journal signals I didn’t take?
A one-line note is worth it. It shows whether your reasons for skipping were good ones over time.
Crypto AI Signals sends liquidity shorts, RSI and AI plans to a private Telegram channel, each with an entry and a stop; you place and manage the trade yourself. Try it for 7 days or read the FAQ.
Risk notice. This lesson is education, not financial advice. Crypto futures are leveraged and you can lose some or all of the capital you trade with. A stop-loss limits a loss to the level you set; slippage and fast markets can make it larger. Past examples do not predict future results. Every trade you place is your own decision.